[PYTHON] Increase the font size of the graph with matplotlib
demo
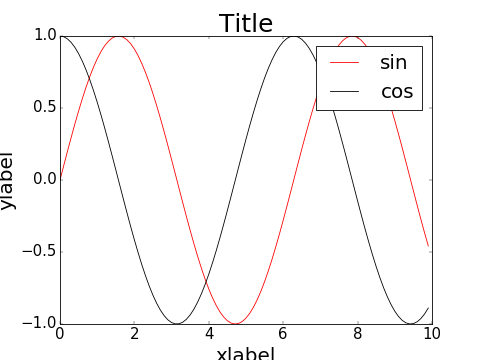
| Before | After |
|---|---|
 |
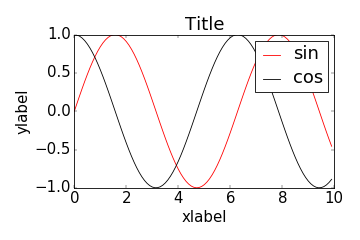 |
Method (1) Specify the font size separately
Each graph element is the character size of the numerical value by giving a numerical value to the keyword argument fontsize. However, for the font size of the scale, specify plt.tick_params (labelsize = 18).
import numpy as np
import matplotlib.pyplot as plt

x = np.arange(0, 10, 0.1)
s = np.sin(x)
c = np.cos(x)

plt.plot(x, s, "r", label="sin")
plt.plot(x, c, "k", label="cos")
plt.title("Title", fontsize=18)
plt.xlabel("xlabel", fontsize=18)
plt.ylabel("ylabel", fontsize=18)
plt.legend(fontsize=18)
plt.tick_params(labelsize=18)

plt.savefig("output.png ")
Method (2) Specify the font size collectively
plt.rcParams["font.size"] = 18
With, you can change the font size of all graph elements at once. The default font size is 12. (Thanks to Tsutomu-KKE @ github, 2016/01/26)
bonus
Adjusting the graph position
A part of the graph may protrude from the output image due to the side effect of increasing the font size of each graph element. Therefore,
plt.tight_layout()
By adding, the position and size of the graph are automatically adjusted, and the protrusion from the output image can be suppressed.
| Before correction | Revised |
|---|---|
 |
 |
For copy
plt.rcParams["font.size"] = 18
plt.tight_layout()
reference
Introduction to matplotlib-Apples are out http://bicycle1885.hatenablog.com/entry/2014/02/14/023734
Tight Layout guide — Matplotlib 1.5.1 documentation http://matplotlib.org/users/tight_layout_guide.html
Recommended Posts