Play handwritten numbers with python Part 2 (identify)
Identify handwritten digit data
In the previous article, I read and imaged handwritten digit data, and then looked at the correlation, but this time I would like to identify what the number is.
Since it is the identification of handwritten numbers, it identifies which of the 10 classes from 0 to 9 the given data corresponds to. So first,
C = \{0, 1, 2, 3, 4, 5, 6, 7, 8, 9\}
Define 10 classes of.
One of the machine learning methods is called "supervised learning", and this pattern is used. With supervised learning, by accumulating a certain number of correct answer data in advance and analyzing it, we create a discriminator necessary for identification, and input the data that we actually want to identify into this discriminator to identify it. It's the way. This data prepared in advance is called teacher data.
Template matching
This time, I would like to try recognizing numbers using the template matching method. Define the representative values of each label (numbers 0 to 9 in this case) and create a classifier. This time, the average value of the teacher data is used as the representative value. The distance between this representative value and the passed data to be identified is calculated and it is said that it belongs to the class of the representative value with the shortest distance.
Last time I was dealing with handwritten digit data of "train_small.csv", but this time it is the full data version "train.csv" ( 42,000 data) will be used as teacher data for learning. Since the numerical data uses 28x28 image data, it can be represented by a 784-dimensional vector, and each of the teacher data is
y_i= (y_1, y_2,...,y_{784}) (i=0,1,...,9)
It is expressed as. $ i $ is a class for each number.
Here, the representative value is described as $ \ hat {y} _i $.
For example, the representative value of a class with the number 8 is $ \ hat {y} _8 $. The representative values are as follows on average.
$ n_i $ is the number of teacher data for each number.
\hat{y}_i = \frac{1}{n_i}\sum_{j=1}^{n_i} y_j
Now, if the target data to be identified is expressed as $ x_j $
x_j= (x_1, x_2,...,x_{784})
As it is also represented by a 784-dimensional vector, as a discriminator
{\rm argmin}_i{({\rm distance}_i)} = {\rm argmin}_i{(\|\hat{y}_i - x_j\|)}
Is used.
Derivation and display of representative values
I will actually calculate. Import the required libraries first.
import numpy as np
import matplotlib.pyplot as plt
import matplotlib.cm as cm
from collections import defaultdict
Define a function as a utility. The first digit is the label, and the data after that are the function add_image () that divides it and classifies it by class, the function count_label () that counts the number for each label, and the plot_digits () for graph drawing.
image_dict = dict()

def add_image(label, image_vector):
    vec = np.array(image_vector)
    if label in image_dict:
        image_dict[label] += vec
    else:
        image_dict[label] = vec
    return image_dict

label_dd = defaultdict(int)
def count_label(data):
    for d in data:
        label_dd[d[0]] += 1
    return label_dd

def plot_digits(X, Y, Z, size_x, size_y, counter, title):
    plt.subplot(size_x, size_y, counter)
    plt.title(title)
    plt.xlim(0,27)
    plt.ylim(0,27)
    plt.pcolor(X, Y, Z)
    plt.gray()
    plt.tick_params(labelbottom="off")
    plt.tick_params(labelleft="off")
First, create a representative value $ \ hat {y} _i $ and display it as an image.
size = 28
raw_data= np.loadtxt('train_master.csv',delimiter=',',skiprows=1)

# draw digit images
plt.figure(figsize=(11, 6))

# data aggregation
for i in range(len(raw_data)):
    add_image(raw_data[i,0],raw_data[i,1:785])

count_dict = count_label(raw_data)

standardized_digit_dict = dict()   #Dictionary object to store representative values
count = 0
for key in image_dict.keys():
    count += 1
    X, Y = np.meshgrid(range(size),range(size))
    num = label_dd[key]
    Z = image_dict[key].reshape(size,size)/num
    Z = Z[::-1,:]
    standardized_digit_dict[int(key)] = Z
    plot_digits(X, Y, standardized_digit_dict[int(key)], 2, 5, count, "")

plt.show()

Last time, when I visualized individual data and displayed it, there were some that did not seem to be numbers, but if you superimpose a lot of data and take the average, beautiful numbers will come out. This will be the representative value of each class and will be compared with the data to be identified.
Perform identification: Try one first
It is finally the execution of identification. First of all, I would like to see what the distance between one identification target data and the representative value of each class is in order to grasp the image. The data to be identified will be downloaded from Kaggle. Use test.csv from the Data Page (https://www.kaggle.com/c/digit-recognizer/data). Since there are a few, I am preparing the data extracted from the first 200 (test_small.csv)
test_data= np.loadtxt('test_small.csv',delimiter=',',skiprows=1)

# compare 1 tested digit vs average digits with norm
plt.figure(figsize=(10, 9))

for i in range(1):    #Try only the first one
    result_dict = defaultdict(float)

    X, Y = np.meshgrid(range(size),range(size))
    Z = test_data[i].reshape(size,size)
    Z = Z[::-1,:]
    flat_Z = Z.flatten()
    plot_digits(X, Y, Z, 3, 4, 1, "tested")

    count = 0
    for key in standardized_digit_dict.keys():
        count += 1
        X1 = standardized_digit_dict[key]
        flat_X1 = standardized_digit_dict[key].flatten()
        norm = np.linalg.norm(flat_X1 - flat_Z)   #Derivation of the distance between each representative value and the data to be identified
        plot_digits(X, Y, X1, 3, 4, (1+count), "d=%.3f"% norm)

plt.show()
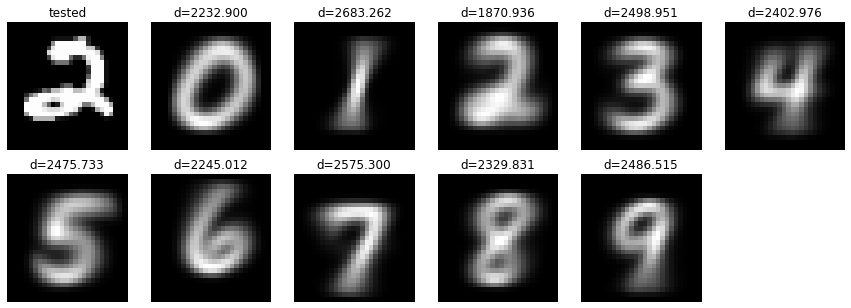
The data to be identified is "2", but what about the result? The distance is displayed above each image. Looking at this number, d = 1870.936 above "2" is the smallest! Identification is successful! : relaxed:
Execution of identification: Identification result of 200 data
Now let's identify 200 pieces of data and see how accurate they are.
# recognize digits
plt.figure(figsize=(15, 130))

for i in range(len(test_data)):
    result_dict = defaultdict(float)

    X, Y = np.meshgrid(range(size),range(size))
    tested = test_data[i].reshape(size,size)
    tested = tested[::-1,:]
    flat_tested = tested.flatten()

    norm_list=[]
    count = 0
    for key in standardized_digit_dict.keys():
        count += 1
        sdd = standardized_digit_dict[key]
        flat_sdd = sdd.flatten()
        norm = np.linalg.norm(flat_sdd - flat_tested)
        norm_list.append((key, norm))

    norm_list = np.array(norm_list)
    min_result = norm_list[np.argmin(norm_list[:,1])]

    plot_digits(X, Y, tested, 40, 5, i+1, "l=%d, n=%d" % (min_result[0], min_result[1]))

plt.show()
I tried to apply 200 identification target data to this identification machine, and the correct answer rate was 80% (160/200), which was a bad result! : smile: Isn't it a good result for the simple method of just measuring the distance from the average value? Please see the figure below for the actual detailed data.

Analyzing the cases that could not be identified, it was particularly difficult to identify 4 and 9, and 6 identification errors occurred. Next, 1-7, 1-8, 3-5, 3-8, 3-9, 8-9 are three errors respectively. After all, the numbers look a little similar.
** Identification error summary **
| combination of label | count |
|---|---|
| 4-9 | 6 |
| 1-7 | 3 |
| 1-8 | 3 |
| 3-5 | 3 |
| 3-8 | 3 |
| 3-9 | 3 |
| 8-9 | 3 |
| 2-3 | 2 |
| 4-6 | 2 |
| 0-2 | 1 |
| 0-3 | 1 |
| 0-4 | 1 |
| 0-5 | 1 |
| 0-8 | 1 |
| 1-2 | 1 |
| 1-3 | 1 |
| 1-5 | 1 |
| 2-7 | 1 |
| 2-8 | 1 |
| 4-7 | 1 |
| 5-9 | 1 |
Overview of template matching method
Finally, I would like to give a brief overview of the template matching method. The numerical data this time is 28x28 784-dimensional data and the number of dimensions is high, so it can not be graphed, but I will explain it as if it is two-dimensional to give an image. See the scatter plot below. The data for each number class can be distinguished by color, and the data is scattered. This is an image of a set of teacher data. Take this as a representative value and average it. The representative values are represented by slightly larger dots on the graph.

For example, if the black dot below is the identification target data, the closest representative value is the representative value of class "7", so this identification target data is identified as class "7". This is the template matching method used this time.

Recommended Posts