[PYTHON] [pyqtgraph] Understand SignalProxy and create a crosshair that follows the cursor on the graph
Thing you want to do
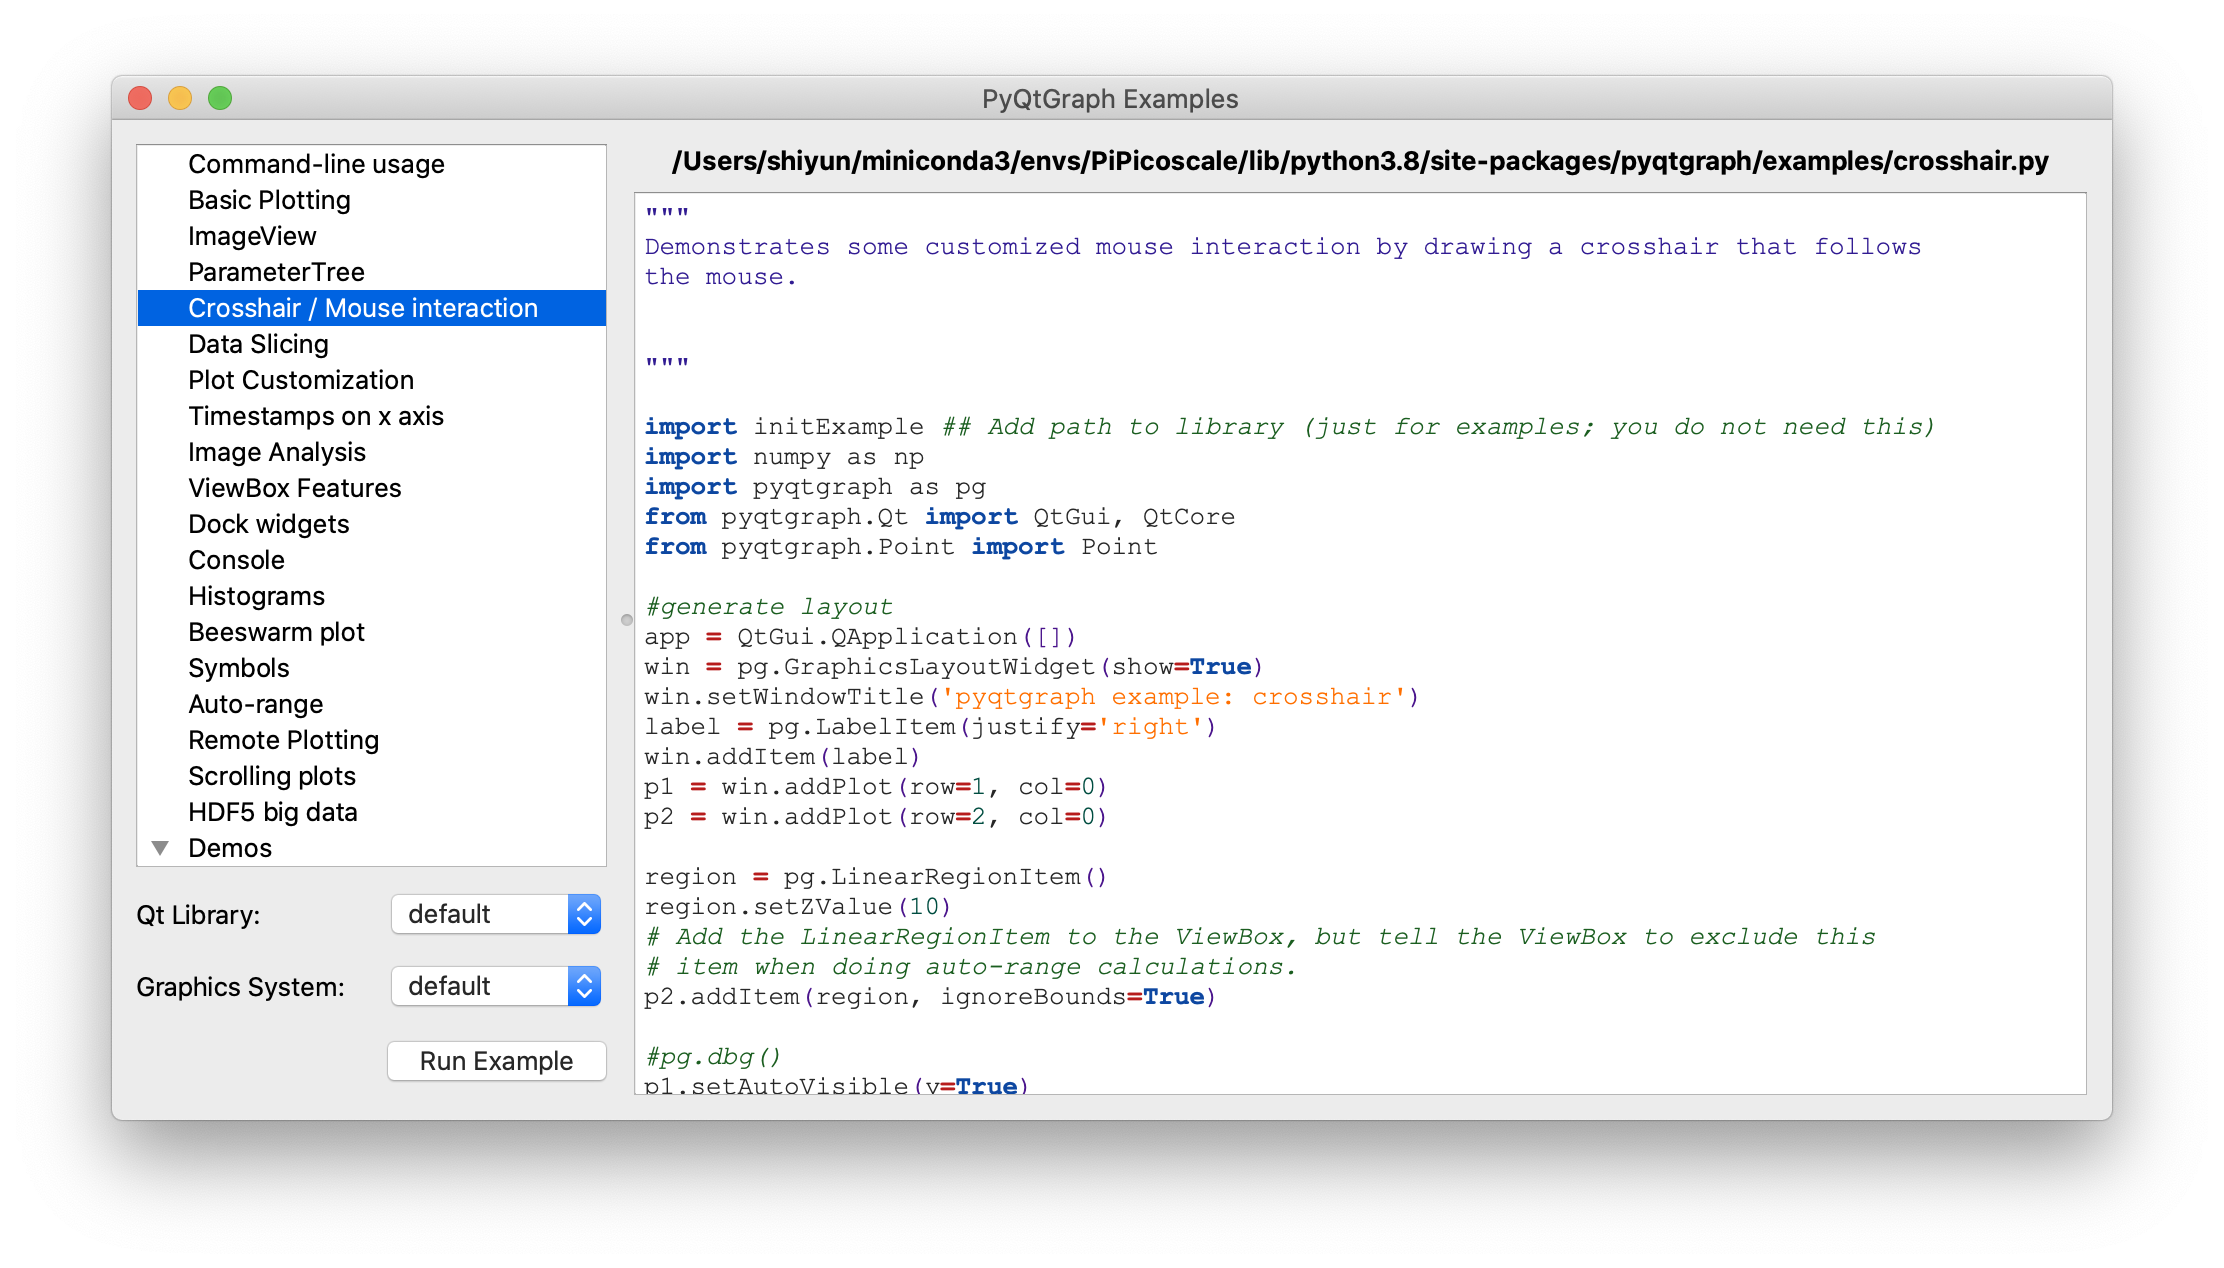
I want to create a crosshair that moves according to the cursor in Crosshair / Mouse interaction of pyqtgraph.exsamples.run ().
There was a script I saw for the first time in the sample code.
proxy = pg.SignalProxy(p1.scene().sigMouseMoved, rateLimit=60, slot=mouseMoved)
SignalProxy creates a crosshair while understanding what it is doing.
environment
Mac OS Python 3.8.5
PyQt5 5.15.2 PyQt5-sip 12.8.1 pyqtgraph 0.11.1
pip install PyQt5 PyQt5-sip pyqtgraph
pyqtgraph.exsamples
import pyqtgraph.examples as ex
ex.run()
You can see various sample graphs at. I referred to Crosshair / Mouse interaction this time.
SignalProxy Contents of SignalProxy doc
Object which collects rapid-fire signals and condenses them into a single signal or a rate-limited stream of signals. Used, for example, to prevent a SpinBox from generating multiple signals when the mouse wheel is rolled over it.
Emits sigDelayed after input signals have stopped for a certain period of time.
Initialization arguments: signal - a bound Signal or pyqtSignal instance delay - Time (in seconds) to wait for signals to stop before emitting (default 0.3s) slot - Optional function to connect sigDelayed to. rateLimit - (signals/sec) if greater than 0, this allows signals to stream out at a steady rate while they are being received.
An object to use when the same signal is generated in large numbers in a short time. Instead of emitting all the generated signals, only one is emitted at regular intervals.
argument
--signal: Specify the signal you want to process --delay: The waiting time from receiving the signal to emitting light. The default is 0.3 seconds. When specifying, enter in seconds. --slot: Slot executed when a signal is emitted --rateLimit: Used when you want to set the exact interval at which the signal is emitted. The unit is [Hz]. The default is 0.
How do you specify the interval?
SignalProxy constructor and the part receiving the signal
The slot is executed when self.timer times out.
    sigDelayed = QtCore.Signal(object)

    def __init__(self, signal, delay=0.3, rateLimit=0, slot=None):
        """Initialization arguments:
        signal - a bound Signal or pyqtSignal instance
        delay - Time (in seconds) to wait for signals to stop before emitting (default 0.3s)
        slot - Optional function to connect sigDelayed to.
        rateLimit - (signals/sec) if greater than 0, this allows signals to stream out at a
                    steady rate while they are being received.
        """

        QtCore.QObject.__init__(self)
        self.delay = delay
        self.rateLimit = rateLimit
        self.args = None
        self.timer = ThreadsafeTimer.ThreadsafeTimer()
        self.timer.timeout.connect(self.flush)
        self.lastFlushTime = None
        self.signal = signal
        self.signal.connect(self.signalReceived)
        if slot is not None:
            self.blockSignal = False
            self.sigDelayed.connect(slot)
            self.slot = weakref.ref(slot)
        else:
            self.blockSignal = True
            self.slot = None

    def signalReceived(self, *args):
        """Received signal. Cancel previous timer and store args to be
        forwarded later."""
        if self.blockSignal:
            return
        self.args = args
        if self.rateLimit == 0:
            self.timer.stop()
            self.timer.start(int(self.delay * 1000) + 1)
        else:
            now = time()
            if self.lastFlushTime is None:
                leakTime = 0
            else:
                lastFlush = self.lastFlushTime
                leakTime = max(0, (lastFlush + (1.0 / self.rateLimit)) - now)

            self.timer.stop()
            self.timer.start(int(min(leakTime, self.delay) * 1000) + 1)
When rateLimit is not specified
The default for rateLimit is 0
        if self.rateLimit == 0:
            self.timer.stop()
            self.timer.start(int(self.delay * 1000) + 1)
The timer is reset to fire self.delay seconds after the signal was last received.
Since timer.start () is specified in milliseconds, * 1000 is used.
When rateLimit is specified
        else:
            now = time()
            if self.lastFlushTime is None:
                leakTime = 0
            else:
                lastFlush = self.lastFlushTime
                leakTime = max(0, (lastFlush + (1.0 / self.rateLimit)) - now)

            self.timer.stop()
            self.timer.start(int(min(leakTime, self.delay) * 1000) + 1)
self.lastFlushTime is the unix time when the signal was last issued.
When enough time has passed since the signal last emitted
Example
self.rateLimit= 5self.lastFlushTime= 100now= 102
leakTime = max(0, (lastFlush + (1.0 / self.rateLimit)) - now)
= max (0, -1.8) and leakTime = 0
After that, self.timer.start (int (min (leakTime, self.delay) * 1000) + 1), self.delay is larger, so it emits light after delay seconds.
When the signal occurs in less than (1 / rateLimit) seconds
Example
self.rateLimit= 5self.lastFlushTime= 100now= 100.01
leakTime = max(0, (lastFlush + (1.0 / self.rateLimit)) - now)
= max (0, 0.19) and leakTime = 0.19
Subsequent self.timer.start (int (min (leakTime, self.delay) * 1000) + 1) will emit light after leaktime seconds if it is larger than self.delay.
0.01 seconds have passed since the last issue until now, so 0.01 + 0,19 = 0.2 = 5 [Hz]
in short
First this is
proxy = pg.SignalProxy(p1.scene().sigMouseMoved, rateLimit=60, slot=mouseMoved)
It means to execute mouseMoved every 60 Hz when the mouse moves (p1.scene (). SigMouseMoved).
code
Now that I know what SignalProxy is doing, I'll use it.
Use numpy for plotting. pip install numpy
"""Add a crosshair to the graph to follow the mouse cursor"""

import dataclasses
from typing import Optional
import sys

import numpy as np
from PyQt5 import QtWidgets, QtCore
import pyqtgraph as pg

SAMPLE_DATA = np.random.rand(500) * 10


@dataclasses.dataclass
class AddLineWidget(pg.GraphicsLayoutWidget):
    """Main screen
    Attributes #
    ----------
    parent: Optional[QtWidgets.QWidget] default=None
Parent screen
    plotter: pyqtgraph.graphicsItems.PlotItem.PlotItem.PlotItem
Main graph
    view_box: pyqtgraph.graphicsItems.ViewBox.ViewBox.ViewBox
ViewBox of the main graph
    vertical_line: pyqtgraph.graphicsItems.InfiniteLine.InfiniteLine
Vertical line chasing the mouse cursor
    horizontal_line: pyqtgraph.graphicsItems.InfiniteLine.InfiniteLine
Horizontal line chasing the mouse cursor
    proxy: pyqtgraph.SignalProxy.SignalProxy
Controls the emission of signals that occur when the mouse cursor moves
    """
    parent: Optional[QtWidgets.QWidget] = None

    def __post_init__(self) -> None:
        """Superclass loading and plot,line added"""
        super(AddLineWidget, self).__init__(parent=self.parent)

        self.add_plot_and_viewbox()
        self.add_line()
        self.set_proxy()

    def add_plot_and_viewbox(self) -> None:
        """Add plot and viewbox"""
        self.plotter = self.addPlot(row=0, col=0)
        self.plotter.showGrid(x=True, y=True, alpha=0.8)
        self.plotter.plot(SAMPLE_DATA, pen=pg.mkPen('#f00'))

        # self.ViewBox of plotter
        self.view_box = self.plotter.vb

    def add_line(self):
        """Add a line that moves with the cursor"""
        #Since it is hard to see by default, specify the color and width
        self.vertical_line = pg.InfiniteLine(angle=90, movable=False, pen=pg.mkPen('#fff', width=5))
        self.horizontal_line = pg.InfiniteLine(angle=0, movable=False, pen=pg.mkPen('#fff', width=5))

        self.plotter.addItem(self.vertical_line, ignoreBounds=True)
        self.plotter.addItem(self.horizontal_line, ignoreBounds=True)

    def set_proxy(self) -> None:
        """Set Signal Proxy"""
        self.proxy = pg.SignalProxy(self.plotter.scene().sigMouseMoved, rateLimit=60, slot=self.mouse_moved)

    @QtCore.pyqtSlot(tuple)
    def mouse_moved(self, evt) -> None:
        """A function that is executed every 60 FPS when the mouse moves
        PlotItem.scene().sigMouseMoved returns screen pixel coordinates instead of graph coordinates

        Parameters
        ----------
        evt: tuple
Screen pixel coordinates
            ex) (PyQt5.QtCore.QPointF(2.0, 44.0),)
        """
        #Get screen pixel coordinates
        # ex) pos=PyQt5.QtCore.QPointF(2.0, 44.0)
        pos = evt[0]
        #If pos is the coordinates in the graph
        if self.plotter.sceneBoundingRect().contains(pos):
            #Get coordinates of graph
            # ex) mousePoint=PyQt5.QtCore.QPointF(141.6549821809388, 4.725564511858496)
            mouse_point = self.view_box.mapSceneToView(pos)
            #Mouse the line_Move to the coordinates of point
            # ex) mouse_point.x()=46.13389087421787
            self.vertical_line.setPos(mouse_point.x())
            # ex) mouse_point.y()=9.535145662930628
            self.horizontal_line.setPos(mouse_point.y())


def main() -> None:
    app = QtWidgets.QApplication(sys.argv)
    window = AddLineWidget(parent=None)
    window.show()
    sys.exit(app.exec_())


if __name__ == "__main__":
    main()
Display coordinates in the upper right
"""Add a crosshair to the graph to follow the mouse cursor"""

import dataclasses
from typing import Optional
import sys

import numpy as np
from PyQt5 import QtWidgets, QtCore
import pyqtgraph as pg

SAMPLE_DATA = np.random.rand(500) * 10


@dataclasses.dataclass
class AddLineWidget(pg.GraphicsLayoutWidget):
    """Main screen
    Attributes #
    ----------
    parent: Optional[QtWidgets.QWidget] default=None
Parent screen
    plotter: pyqtgraph.graphicsItems.PlotItem.PlotItem.PlotItem
Main graph
    view_box: pyqtgraph.graphicsItems.ViewBox.ViewBox.ViewBox
ViewBox of the main graph
    vertical_line: pyqtgraph.graphicsItems.InfiniteLine.InfiniteLine
Vertical line chasing the mouse cursor
    horizontal_line: pyqtgraph.graphicsItems.InfiniteLine.InfiniteLine
Horizontal line chasing the mouse cursor
    proxy: pyqtgraph.SignalProxy.SignalProxy
Controls the emission of signals that occur when the mouse cursor moves
    """
    parent: Optional[QtWidgets.QWidget] = None

    def __post_init__(self) -> None:
        """Superclass loading and label, plot,line added"""
        super(AddLineWidget, self).__init__(parent=self.parent)

        self.add_label()
        self.add_plot_and_viewbox()
        self.add_line()
        self.set_proxy()

    def add_plot_and_viewbox(self) -> None:
        """Add plot and viewbox"""
        self.plotter = self.addPlot(row=0, col=0)
        self.plotter.showGrid(x=True, y=True, alpha=0.8)
        self.plotter.plot(SAMPLE_DATA, pen=pg.mkPen('#f00'))

        # self.ViewBox of plotter
        self.view_box = self.plotter.vb

    def add_label(self) -> None:
        """Added label to display coordinates"""
        self.label = pg.LabelItem(justify='right')
        self.addItem(self.label)


    def add_line(self):
        """Add a line that moves with the cursor"""
        #Since it is hard to see by default, specify the color and width
        self.vertical_line = pg.InfiniteLine(angle=90, movable=False, pen=pg.mkPen('#fff', width=5))
        self.horizontal_line = pg.InfiniteLine(angle=0, movable=False, pen=pg.mkPen('#fff', width=5))

        self.plotter.addItem(self.vertical_line, ignoreBounds=True)
        self.plotter.addItem(self.horizontal_line, ignoreBounds=True)

    def set_proxy(self) -> None:
        """Set Signal Proxy"""
        self.proxy = pg.SignalProxy(self.plotter.scene().sigMouseMoved, rateLimit=60, slot=self.mouse_moved)

    @QtCore.pyqtSlot(tuple)
    def mouse_moved(self, evt) -> None:
        """A function that is executed every 60 FPS when the mouse moves
        PlotItem.scene().sigMouseMoved returns screen pixel coordinates instead of graph coordinates

        Parameters
        ----------
        evt: tuple
Screen pixel coordinates
            ex) (PyQt5.QtCore.QPointF(2.0, 44.0),)
        """
        #Get screen pixel coordinates
        # ex) pos=PyQt5.QtCore.QPointF(2.0, 44.0)
        pos = evt[0]
        #If pos is the coordinates in the graph
        if self.plotter.sceneBoundingRect().contains(pos):
            #Get coordinates of graph
            # ex) mousePoint=PyQt5.QtCore.QPointF(141.6549821809388, 4.725564511858496)
            mouse_point = self.view_box.mapSceneToView(pos)

            # SAMPLE_If the coordinates are in DATA, x,Display y value
            index = int(mouse_point.x())
            if 0 < index < len(SAMPLE_DATA):
                self.label.setText(
                    f"<span style='font-size: 18pt'>x={mouse_point.x():.3f},"
                    f"<span style='color: red'>y1={SAMPLE_DATA[index]:.3f}</span>")

            #Mouse the line_Move to the coordinates of point
            # ex) mouse_point.x()=46.13389087421787
            self.vertical_line.setPos(mouse_point.x())
            # ex) mouse_point.y()=9.535145662930628
            self.horizontal_line.setPos(mouse_point.y())


def main() -> None:
    app = QtWidgets.QApplication(sys.argv)
    window = AddLineWidget(parent=None)
    window.show()
    sys.exit(app.exec_())


if __name__ == "__main__":
    main()
reference
SignalProxy Python pyqtgraph package v0.10.0, pyqtgraph.SignalProxy module source code :: PyDoc.net
ViewBox ViewBox — pyqtgraph 0.11.1.dev0 documentation
SignalProxy Python pyqtgraph package v0.10.0, pyqtgraph.SignalProxy module source code :: PyDoc.net
Recommended Posts