I checked the distribution of the number of video views of "Flag-chan!" [Python] [Graph]
Introduction
I tried plotting the number of views in Previous article, but this time I was able to automatically create a dataset using the API, and I was just curious about the distribution of the number of views. This led to the creation of this article.
Notes
Also, since it was recorded before the release of the 2021/1/3 video, it may differ from the current information. Please note that I just tried to see the distribution using the histogram for the time being.
Data set used
Full power avoidance flag-chan! Based on the number of views obtained from the channel using YouTube Data API v3.
program
This is a program that creates a histogram.
Graphing program
%matplotlib inline
import numpy as np
import pandas as pd
import matplotlib.pyplot as plt
import datetime
import matplotlib.dates as mdates
import matplotlib.patches as mpatches
from matplotlib.path import Path
from pandas.plotting import register_matplotlib_converters
register_matplotlib_converters()

bins = 40
maxy = 30

#CSV file for dataset
file = "2021-01-03_flag_videos_datasets.csv"
#Date,Views
num_play = pd.read_csv(file, header=0, encoding='UTF8', usecols=[3, 5], parse_dates=[0])
num_play = num_play.dropna(how='all')


# debug
#print(num_play)
#num_play.to_csv('exam_num_play.csv')

#Graph to plot
#Date
x = num_play[num_play.columns[0]]
#print(type(x[0]))

#Views
y1 = num_play[num_play.columns[1]]

#Graph size
plt.figure(figsize=(20.0, 10.0), dpi=300)
#Font settings
plt.rcParams['font.family'] = 'Times New Roman'


#Graph plot
##Plot the number of views in a bar graph
play_hist = plt.hist(y1, bins=bins, color="lightblue")


#Axis range
plt.ylim([0, maxy])

#Graph title
plt.title("Full power avoidance flag!Video aggregate data", fontname="MS Gothic", fontsize=20)

#Axis memory
plt.tick_params(axis='x', labelsize=20, labelrotation=45)
plt.tick_params(axis='y', labelsize=20)

#Label name
plt.xlabel("Views", fontsize=20, fontname="MS Gothic")
plt.ylabel("quantity", fontname="MS Gothic", fontsize=20)

##Plot the mean and median with horizontal lines
avg = plt.vlines(num_play.mean(axis=0), 0, maxy, 'b', linestyles='dashed')

#Usage Guide
avg_title = "Average value"

plt.legend([avg], [avg_title], bbox_to_anchor=(1.0, 1.0), prop={"family":"MS Gothic", 'size':20}, markerscale=3)

#Save image
plt.savefig("flag_video_hist_graph.png ", bbox_inches="tight", pad_inches=0.0)
Graphed result
The graph below is the result of this article. The horizontal axis is the number of views, and the vertical axis is the number of videos that belong to that number of views. The average value is 760,946 times rounded down to the nearest whole number.
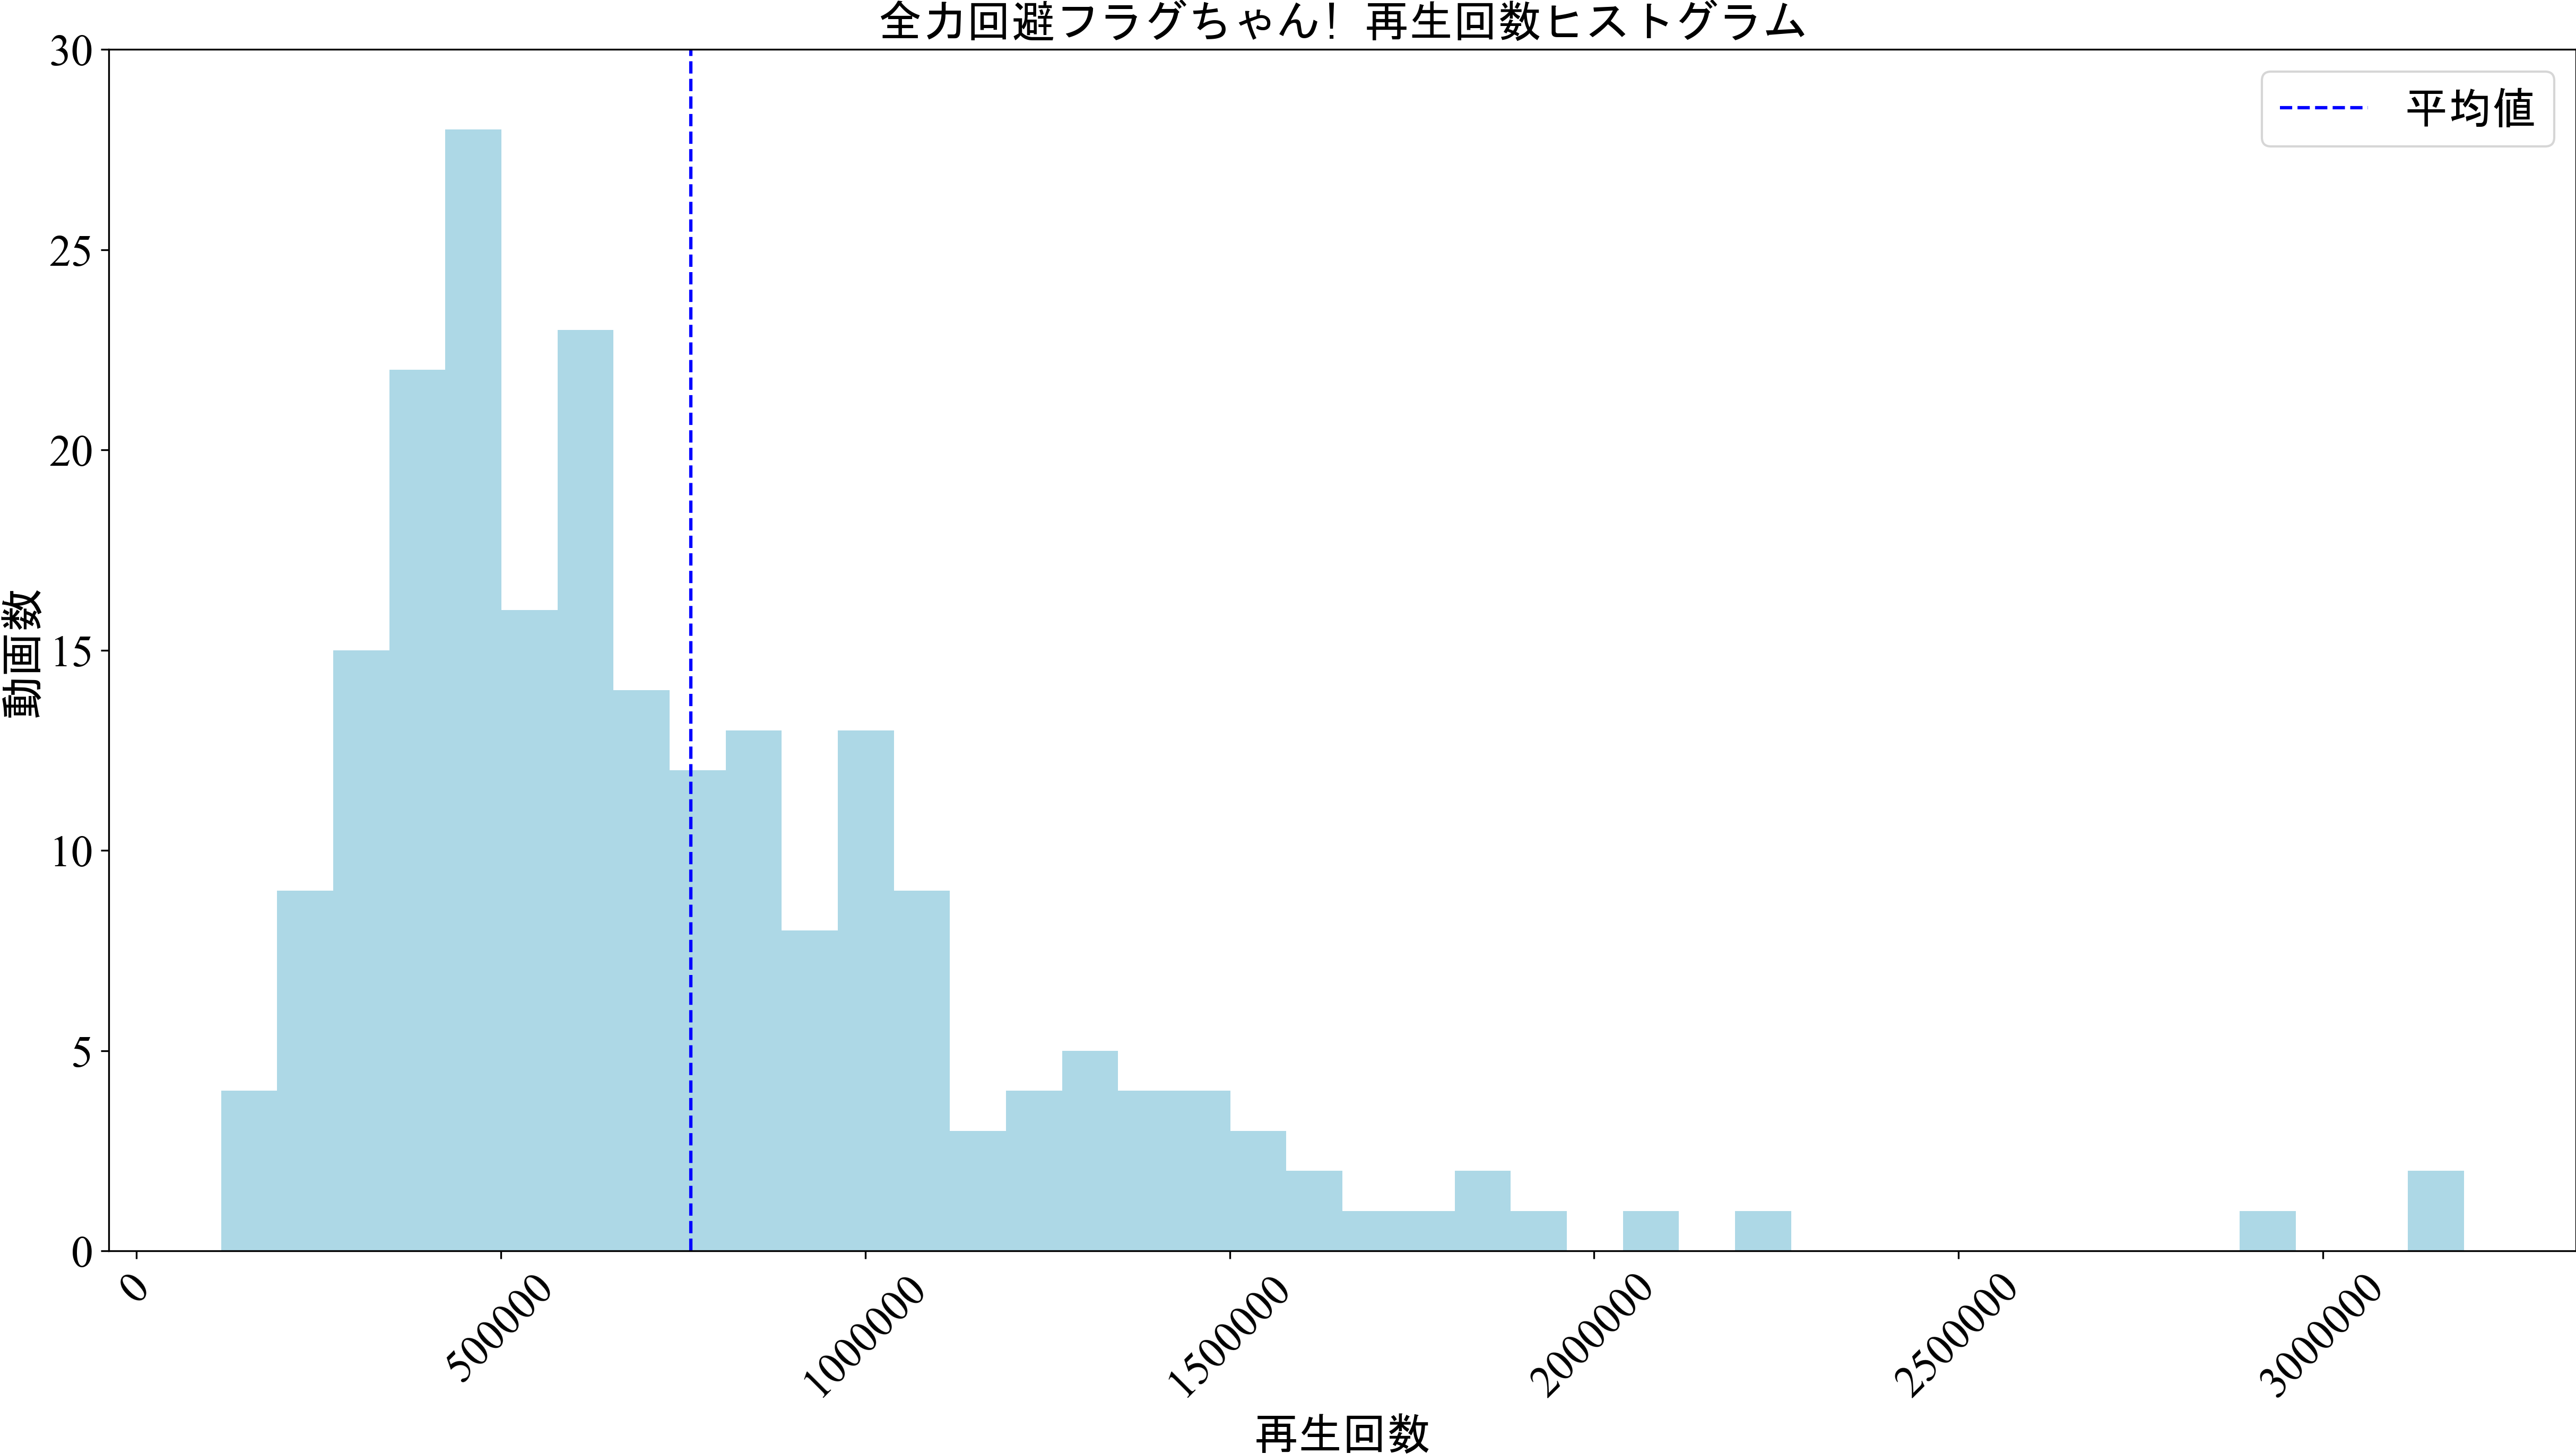
A brief consideration?
... When you look at the outline of the graph, it looks like a Poisson distribution ... It's not invisible ... There is a class of views that doesn't exist at all, but ... There may not be enough samples, but there are no more videos.
Simple conclusion
This is a textbook, but it is the conclusion of this article.
--If you plot the number of views of the video of "Full power avoidance flag-chan!" As a histogram, you can see the outline of the Poisson distribution. ――In other words, does the number of playbacks follow a Poisson distribution? ?? ??
Future plans
In the future, we plan to acquire the number of playbacks in terms of date and time and create a histogram. I will write an article again if there is a new discovery.
in conclusion
I don't think anyone has read this far, but if you have any questions, please follow the Full Avoidance Flag-chan! channel and Flag-chan's Twitter from the link below. It's more important than reading this article. It's important, so please subscribe and follow us on Twitter again.
Related Links
--Full power avoidance flag-chan! Https://www.youtube.com/channel/UCo_nZN5yB0rmfoPBVjYRMmw/videos --Plott Inc. / Plott Inc. https://plott.tokyo/#top --Flag-chan's Twitter https://twitter.com/flag__chan
- Github https://github.com/uky007/flag_analysis
Recommended Posts