[PYTHON] I tried to implement a volume moving average with Quantx
Self-introduction
My name is Maskawa (https://www.facebook.com/ryozodesert) and I am an intern at Smart Trade Co., Ltd., a second year student at the Faculty of Science and Engineering of a certain M university. .. I'm still a beginner, so I'm sure there are a lot of things I'm not sure about, but I hope you'll stay with me until the end.
What to do in this article
Since it is the third week of our internship, I would like to introduce the algorithm implemented in Quantx Factory. This time, we will implement a stock trading algorithm using ** moving average **, which is one of the famous technical indicators.
What is QuantX Factory?
Smart Trade Ltd.
Financial democratization
Based on this philosophy, we have developed a platform "QuantX Factory" that allows anyone to easily develop trading algorithms.
Strengths
--No need to build an environment that tends to frustrate beginners --Various data such as closing price, high price, and trading volume of each brand are prepared, No need to prepare data set </ font> --The developed trading algorithm can be sold at the QuantX Store if it passes the examination. --For advanced users, there is also a development environment such as QuantX Lab. (Source: Official Document)
Main subject
Understand how the volume moving average works
What is volume?
――The number of shares that were sold on that day ――You can grasp the activity of buying and selling --The histogram at the bottom of the image below
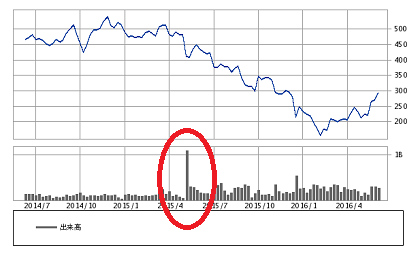
** "Volume precedes stock price" **
It is said that the trading volume changes before the stock price moves. In other words, if you use moving average of volume </ font>, you may find buy and sell signs faster.
What is a moving average?

--A line graph that plots the average value obtained by summing the closing prices for several days and dividing by the number of days. --While observing the "short-term line" and "long-term line", identify the sign of buying and selling. --Short-term line: Moving average with a short number of reference days (generally 5 days) --Long-term line: Moving average line with long reference days (generally 25 days) -Buy at Golden Cross </ font> and give a sell signal at Dead Cross </ font> --For details, please refer to here.
What are Golden Cross and Dead Cross?
- ** Golden Cross: moneybag: ** </ font>
 --This is the moment when the short-term line exceeds the long-term line, indicating that the downtrend will turn into an uptrend.
-** Used as a buy sign **
--This is the moment when the short-term line exceeds the long-term line, indicating that the downtrend will turn into an uptrend.
-** Used as a buy sign **
- ** Dead Cross ** </ font>: skull:
 ――The moment when the short-term line falls below the long-term line, it indicates that the uptrend turns into a downtrend.
-** Used as a sell sign **
――The moment when the short-term line falls below the long-term line, it indicates that the uptrend turns into a downtrend.
-** Used as a sell sign **
What is a volume moving average?
--Instead of the closing price for several days, the moving average of volume </ font> for several days is taken. --The way to issue buy and sell signals is the same as the moving average.
| Short-term and long-term line status | Guideline for judgment |
|---|---|
| Golden cross occurs | Buy signal |
| Short-term line>Long-term line | Uptrend |
| Short-term line<Long-term line | Downtrend |
| Dead cross occurs | Sell sign |
code
# Sample Algorithm
#Library import
#Required library
import maron
import maron.signalfunc as sf
import maron.execfunc as ef
#Additional library
#Please see the notes on the right screen for the libraries that can be used ①
import pandas as pd
import talib as ta
import numpy as np

#Order method(Please uncomment only one of the following two according to the desired ordering method)
#Please see the note on the right screen for the ordering method ②
#ot = maron.OrderType.MARKET_CLOSE #Order at the timing of the closing price the day after the signal is issued
ot = maron.OrderType.MARKET_OPEN   #Order at the timing of the opening price the day after the signal is issued
#ot = maron.OrderType.LIMIT        #Limit order

#Acquisition of stocks and columns
#Please see the note on the right screen for the designation of the brand ③
#Please see the note on the right screen for getting columns ④
def initialize(ctx):
  #Setting
  ctx.logger.debug("initialize() called")
  ctx.high_term = 10
  ctx.holding_days = 5
  ctx.configure(
    channels={               #Channel used
      "jp.stock": {
        "symbols": [
            "jp.stock.2914", #JT(Japan Tobacco)
            "jp.stock.8766", #Tokio Marine Holdings
            "jp.stock.8031", #Mitsui
            "jp.stock.8316", #Sumitomo Mitsui Financial Group
            "jp.stock.8411", #Mizuho Financial Group
            "jp.stock.9437", #NTT DoCoMo
            "jp.stock.4502", #Takeda Pharmaceutical Company
            "jp.stock.8058", #Mitsubishi Corporation
            "jp.stock.9433", #KDDI
            "jp.stock.9432", #Nippon Telegraph and Telephone
            "jp.stock.7267", #Honda (Honda Motor Co., Ltd.)
            "jp.stock.8306", #Mitsubishi UFJ Financial Group
            "jp.stock.4503", #Astellas Pharma
            "jp.stock.4063", #Shin-Etsu Chemical
            "jp.stock.7974", #Nintendo
            "jp.stock.6981", #Murata Manufacturing Co., Ltd.
            "jp.stock.3382", #Seven & i Holdings
            "jp.stock.9020", #East Japan Railway Company
            "jp.stock.8802", #Mitsubishi Estate
            "jp.stock.9022", #Central Japan Railway Company
            "jp.stock.9984", #Softbank Group
            "jp.stock.6861", #Keyence
            "jp.stock.6501", #Hitachi
            "jp.stock.6752", #Panasonic
            "jp.stock.6758", #Sony
            "jp.stock.6954", #FANUC
            "jp.stock.7203", #Toyota Motor
            "jp.stock.7751", #Canon
            "jp.stock.4452", #Kao
            "jp.stock.6098", #Recruit Holdings
        ],
        "columns": [
          "close_price",     #closing price
          "close_price_adj", #closing price(After stock split adjustment)
          "volume_adj",     #Volume
          #"txn_volume",     #Trading price
        ]
      }
    }
  )

  #Signal definition
  def _my_signal(data):
    #Get volume data
    vol = data["volume_adj"].fillna(method = "ffill")


    syms = data.minor_axis   #Creating a stock list
    dates = data.major_axis  #Creating a date list


    #Volume moving average
    mav5 = vol.rolling(window = 5, center = False).mean()
    mav25 = vol.rolling(window = 25, center = False).mean()

    ratio = mav5 / mav25

    #Golden cross, dead cross of volume moving average
    vol_golden = (ratio >= 1.04) & (ratio.shift(1) < 1.0) #(mav5 > mav25) & (mav5.shift(1) < mav25.shift(1))
    vol_dead = (ratio <= 0.97)  & (ratio.shift(1) > 1.0)  #(mav5 < mav25) & (mav5.shift(1) > mav25.shift(1))
    #The shift method shifts the data in the DataFrame by one and compares it with the ratio of the previous day to determine the golden cross and dead cross.

    #Trading signal generation part

    buy_sig = vol_golden
    sell_sig =  vol_dead

    #market_Create a data frame called sig that contains all 0s
    market_sig = pd.DataFrame(data=0.0, columns=syms, index=dates)

    #buy_1 when sig is True.0、sell_When sig is True-1.Set to 0
    market_sig[buy_sig == True] = 1.0
    market_sig[sell_sig == True] = -1.0
    market_sig[(buy_sig == True) & (sell_sig == True)] = 0.0
    # ctx.logger.debug(market_sig)

    return {
      "mav5:g2": mav5,
      "mav25:g2": mav25,
      "market:sig": market_sig,
    }

  #Signal registration
  ctx.regist_signal("my_signal", _my_signal)

def handle_signals(ctx, date, current):  #Daily processing part
  '''
  current: pd.DataFrame
  '''
  #initialize_my_Market the signal generated by signal_Store in sig
  market_sig = current["market:sig"]
  done_syms = set([])  #Set type that stores stocks that have been profit-taking and loss-cutting
  none_syms = set([])  # portfolio.Set type that stores stocks that do not exist in positions
  # portfolio.positions(Brands you own)Target stocks(sym)Check if there is
  for (sym, val) in market_sig.items():
    if sym not in ctx.portfolio.positions:
      none_syms.add(sym)
  # portfolio.positions(Brands you own)Each brand of(sym)Check if the number of shares held by
  for (sym, val) in ctx.portfolio.positions.items():
    if val["amount"] == 0:
      none_syms.add(sym)
  #Loss cut, profit taking(Profitability)settings of
  #Iterative process to check the stocks you own one by one
  for (sym, val) in ctx.portfolio.positions.items():
    #Acquisition of profit / loss ratio
    returns = val["returns"]
    if returns < -0.03:  #Profit and loss ratio-3%Less than(Absolute value 3%Greater loss)in the case of
      #Sell order for loss cut
      sec = ctx.getSecurity(sym)
      sec.order(-val["amount"], comment="Loss cut(%f)" % returns)
      #Added the issue assigned to sym to the set type that stores the issue for which profit settlement and loss cut have been performed.
      done_syms.add(sym)
    elif returns > 0.05:  #Profit and loss ratio+5%If greater than
      #Profit taking(Profitability)Sell order for
      sec = ctx.getSecurity(sym)
      sec.order(-val["amount"], comment="Profit-taking sale(%f)" % returns)
      #Added the issue assigned to sym to the set type that stores the issue for which profit settlement and loss cut have been performed.
      done_syms.add(sym)
  buy = market_sig[market_sig > 0.0]  #Buy signal
  for (sym, val) in buy.items():  #Process stocks with buy signals one by one
    # done_syms or none_If syms has sym
    if sym in done_syms:
      continue  #Skip processing
    #Buy order
    sec = ctx.getSecurity(sym)
    sec.order(sec.unit() * 1, orderType=ot, comment="SIGNAL BUY")
    #If you want to output the buy order log below, please uncomment the following(Long-term caution)
    #ctx.logger.debug("BUY: %s,  %f" % (sec.code(), val))
  sell = market_sig[market_sig < 0.0]  #Sell signal
  for (sym, val) in sell.items():  #Process stocks with sell signals one by one
    # done_syms or none_If syms has sym
    if (sym in done_syms) | (sym in none_syms):
      continue  #Skip processing
    #Sell order
    sec = ctx.getSecurity(sym)
    sec.order(sec.unit() * -1,orderType=ot, comment="SIGNAL SELL")
--The completed code is here --The details of the algorithm are described in the comments on each line.
result

Evaluation / consideration
--Sharp Ratio (investment efficiency) is reasonably good
――The profit and loss ratio for one year is also excellent at 18%
――If you look at individual stocks, you may be vulnerable to a sharp drop or surge.
--Example: Takeda Pharmaceutical Company's price movement from February 18, 2019 to February 18, 2020

At the end
In the last three weeks, I've learned a lot about how to develop basic algorithms with QuantX Factory! In the future, I would like to further improve the quality of the algorithm by combining the volume moving average with other technical indicators and incorporating machine learning. That concludes this article. Thank you for reading the poor text to the end!
Disclaimer Precautions
Please note that we are not responsible for any profit or loss caused by actual transactions using this code / knowledge.
materials https://qiita.com/Miku_F/items/49c20fcbbbfae59cb9a6
https://www.kabutore.biz/idoheikinsen.html
https://ib-college.com/idou-heikin
Recommended Posts