[Python] (Linie) Extrahieren Sie Werte aus Diagrammbildern
Einführung
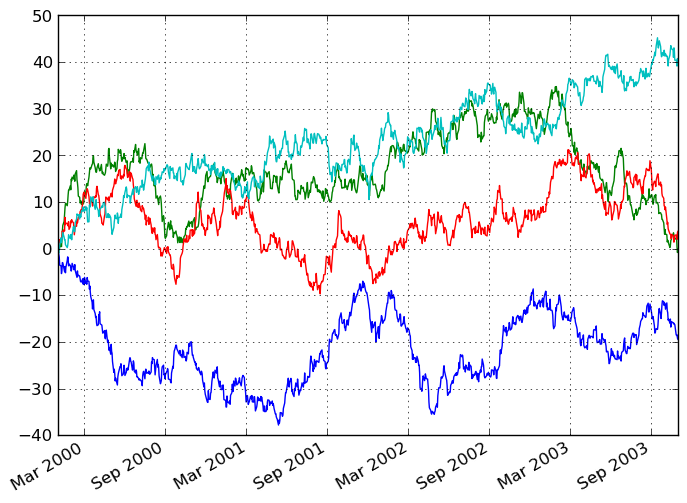
Gibt es ein Diagramm, aber keine Daten ...? Wenn Sie ein Bild haben, extrahieren wir es.
 pandas 0.7.3 documentation -Plotting with matplotlib

↑ ~~ Wenn dies in Ordnung ist, können Sie nicht viel Genauigkeit erwarten. .. .. ~~
Prozessablauf
Erhalten Sie das gewünschte Diagramm, indem Sie den Farbbereich auswählen ↓ Durchschnitt in vertikaler Richtung ↓ Interpolieren Sie für die Anzahl der gewünschten Samples ↓ Skaleneinstellung ↓ Ausgabe
Implementierung
** Sie können es hier in Colab ausführen **
import numpy as np
import matplotlib.pyplot as plt
from ipywidgets import interact
import requests
from PIL import Image
import io
Holen Sie sich Bilddaten, ignorieren Sie Alpha vorerst
path = "Bildpfad"
im = plt.imread(path)
if im.shape[2] == 4:im = im[:,:,:-1]
if im.max() > 1:im /= 255
h, w, _ = im.shape
plt.imshow(im[::-1])
Schneiden Sie nur den Bereich des Diagramms für eine spätere Anpassung des Maßstabs
@interact(x_min=(0, w), x_max=(0, w), y_min=(0,h), y_max=(0,h))
def Plot(x_min=0, x_max=w, y_min=0, y_max=h):
    global imag
    plt.figure(figsize=(7, 7))
    imag = im[min(y_min,y_max-1):max(y_min+1, y_max), min(x_min,x_max-1):max(x_min+1, x_max)]
    plt.imshow(imag[::-1])
Wählen Sie das Diagramm aus, das Sie durch Auswahl des Farbbereichs extrahieren möchten, und passen Sie den Schwellenwert an, um zu verhindern, dass unnötige Teile eingegeben werden.
@interact(x=(0, imag.shape[1]), y=(0,imag.shape[0]), thresh=(1,10))
def Plot(x, y, thresh):
    global p
    p = ((imag - imag[y, x]) ** 2).sum(axis=2) < (1 / (1<<thresh))
    print(p.sum())
    plt.imshow(p[::-1])
    plt.plot([x, x], [0, imag.shape[0]], color="r")
    plt.plot([0, imag.shape[1]], [imag.shape[0]-y, imag.shape[0]-y], color="r")
Nehmen Sie den Durchschnitt in vertikaler Richtung
p = np.pad(p, 1, "constant")
sx = np.arange(len(p[0]))[p.argmax(axis=0)!=0]
sy = []

for i in p.T:
    j = np.where(i!=0)[0]
    if j.tolist():
        sy.append(j.mean())
Auswahl der Anzahl der Proben, Entfernung des Rauschens durch gleitenden Durchschnitt (Faltung)
@interact(sample=(5, 1250), conv_size=(1, 21, 2))
def fit(sample, conv_size):
    global y
    x = np.linspace(sx.min(), sx.max(), sample)
    y = np.convolve(np.pad(np.interp(x, sx, sy), (conv_size-1)//2, "edge"), np.ones(conv_size) / conv_size, "valid")
    plt.plot(x, y)
    plt.xlim(0,len(p[0]))
    plt.ylim(0, len(p))
Geben Sie den Bereich des Diagramms ein, das zuerst geschnitten wurde
yl = list(map(int,input("Y-range of trimmed graph? ").split(",")))
Skaleneinstellung, Ausgabe
y_out = y * (yl[1] - yl[0]) / p.shape[0] + yl[0]
y_out
Grafikausgabe
plt.plot(y_out)
plt.ylim(*yl)
↑ ist ein Programm für Jupyter und kann daher nur ausgeführt werden, wenn die Zellen durch separate Teile getrennt sind.
schließlich
Die Verwendung ist einfacher, wenn Sie das Trimmen und die Auswahl des Farbbereichs mithilfe von HTML interaktiver gestalten.
Recommended Posts