[PYTHON] Make matplotlib look like a flat design
If you use matplotlib without any settings, it will be output with a rather dull design, so I would like to make an initial setting for making a graph for flat design, which is becoming mainstream recently, and an actual sample.
Initial settings of matplotlib
You can check the configuration file that manages the matplotlib design (graph size and color) with the code below.
python
import matplotlib
matplotlib.matplotlib_fname()
You can directly rewrite the file displayed above, but since there is a class that can control the setting, use it
Considering various details, it is necessary to make quite detailed settings, but once you execute the following code and rewrite the initial settings, a graph like a flat design can be realized to some extent (should)
flat_design
import matplotlib as mpl
from cycler import cycler

#Determine the color cycle first
c_cycle=cycler('color',["#3498db","#e74c3c","#1abc9c","#9b59b6","#f1c40f","#ecf0f1","#34495e",
                  "#446cb3","#d24d57","#27ae60","#663399", "#f7ca18","#bdc3c7","#2c3e50"])

#The following is the initial setting like a flat design

#This time, I use free fonts
#Download the font from the following site and load it
#http://mplus-fonts.osdn.jp/mplus-outline-fonts/
mpl.rc('font', family='VL Gothic', size=25)
#Determine line size and color
mpl.rc('lines', linewidth=2,color="#2c3e50")
mpl.rc('patch', linewidth=0,facecolor="none",edgecolor="none")
mpl.rc('text', color='#2c3e50')
mpl.rc('axes', facecolor='none',edgecolor="none",titlesize=30,labelsize=15,prop_cycle=c_cycle,grid=False)
mpl.rc('xtick.major',size=10,width=0)
mpl.rc('ytick.major',size=10,width=0)
mpl.rc('xtick.minor',size=10,width=0)
mpl.rc('ytick.minor',size=10,width=0)
mpl.rc('ytick',direction="out")
mpl.rc('grid',color='#c0392b',alpha=0.3,linewidth=1)
mpl.rc('legend',numpoints=3,fontsize=15,borderpad=0,markerscale=3,labelspacing=0.2,frameon=False,framealpha=0.6,handlelength=1,handleheight=0.5)
mpl.rc('figure',figsize=(10,6),dpi=80,facecolor="none",edgecolor="none")
mpl.rc('savefig',dpi=100,facecolor="none",edgecolor="none")
Graph sample
Here are some examples of how the graph looks different depending on whether the settings above are reflected or not (matplotlib default settings).
normal_dist.py
import matplotlib.pyplot as plt
import numpy as np

#Display 5 Gaussian distributions while changing the average value
for i in range(0,5,1):
    plt.hist(np.array(np.random.normal(i*2,1,100)),alpha=0.95)

plt.title(u"Title")
plt.xlabel(u"X")
plt.ylabel(u"Y")
plt.axhline(0,linewidth=2)
plt.axis([-2,10,0,30])
Initial design
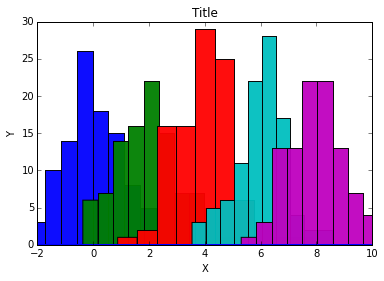
Flat design

By changing the color and eliminating the outer frame of the graph, it was quite refreshing
cos.py
#Show cosine
x = np.arange(-10, 10, 0.1)
y = np.cos(x)
plt.plot(x, y)
Initial design
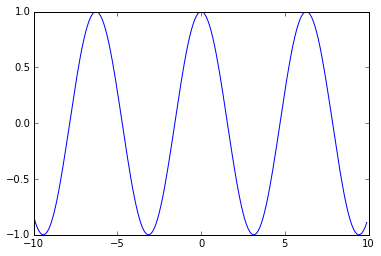
Flat design

It doesn't change much, but if the line thickness or color changes, the impression you get will change (I feel).
Finally, since the color could not be specified in the initial setting, the impression of the pie chart changes considerably even though it is defined again in the function, so it is illustrated.
- There may be a way to set it
pie_chart.py
#pie chart
labels = 'PC', 'SmartPhone', 'Tablet', 'Mobile'
population = [25, 40, 15, 10]

#Interval control
explode = (0.02, 0.02, 0.02,0.02)

#Commented out below in the initial design
c=("#3498db","#1abc9c","#e74c3c","#f1c40f")

plt.pie(population, explode=explode, labels=labels,
       colors=c,
        autopct='%.1f',
         shadow=False, startangle=90)

plt.axis('equal')
Initial design (color is also default)

Flat design

If you use a pie chart, you can clearly see that the color setting is not good.
Reference page
The color scheme like a flat design is borrowed from here https://flatuicolors.com/ http://www.flatuicolorpicker.com/
Around matplotlib settings Japanese with matplotlib Official reference http://matplotlib.org/users/customizing.html
Recommended Posts