[PYTHON] Let's start multivariate analysis and principal component analysis with Pokemon! Collaboration between R and Tableau
Pokemon Go was announced in the fall of 2015 and has become a social phenomenon worldwide, but it is still extremely popular with both children and adults.
I think the reason for its popularity is that Pokemon characters are unique and rich in variety.
I was also a complete Pokemon beginner, but I am trying and erroring if I can do any interesting analysis from Pokemon data.
Global data science competition site: There seems to be quite a bit of data about Pokemon in the dataset published on Kaggle. Pokemon seems to be an interesting research topic for data scientists!
So, this time, I will try to understand the Pokemon attribute data from Kaggle's dataset using principal component analysis.
In the first place, Pokemon seems to have various attributes such as CP (Combat Point: combat power), HP (Hit Point: physical strength), weight, height, etc.
reference:
[Pokemon GO] What is CP? Explains how to raise the upper limit and initial value / CP at evolution
https://pokemongo.gamewith.jp/article/show/23752
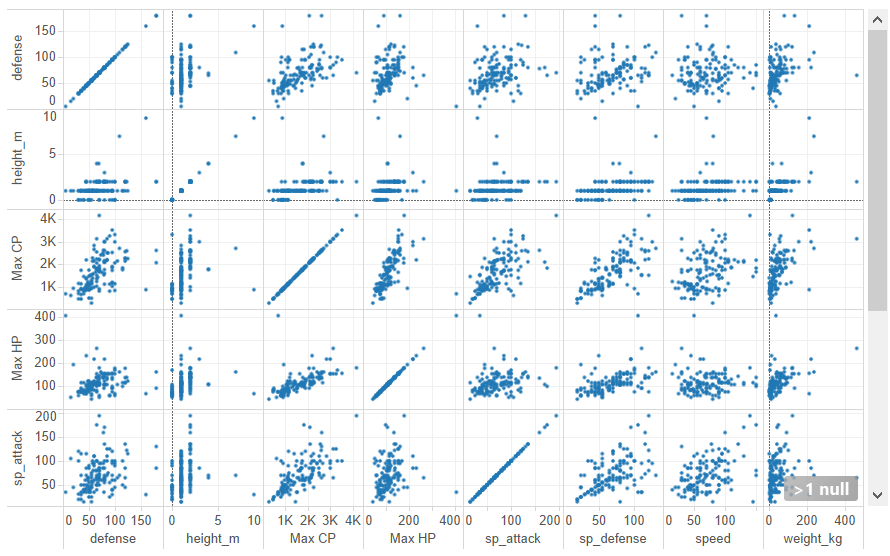
If you draw a scatter plot of brute force of these attributes, it seems that you can understand the correlation of each attribute (for example, if the body is big, the HP is also big ...) However, if the number of variables increases, it is not clear at first glance. right.
Isn't it possible to more effectively represent the attributes of Pokemon on a two-dimensional map and find similar types of Pokemon?
So, this time, I would like to think of a visualization method that allows you to see the attribute distribution of Pokemon at a glance using principal component analysis (PCA).
What is principal component analysis? , "Using the correlation of multivariate data, information loss is minimized. While suppressing to, reduce to a small amount of synthetic variables, reduce the dimensions and analyze ... "
In short, HP, CP, offensive power, defensive power, physical strength, height, etc ... It is difficult for humans to understand if there are many attributes, so put together similar attributes and make it a nice main component. I understand that it is a matter of extracting what is to be and thinking simply. (I'm sorry for the rough understanding.)
I will introduce from the result! !!
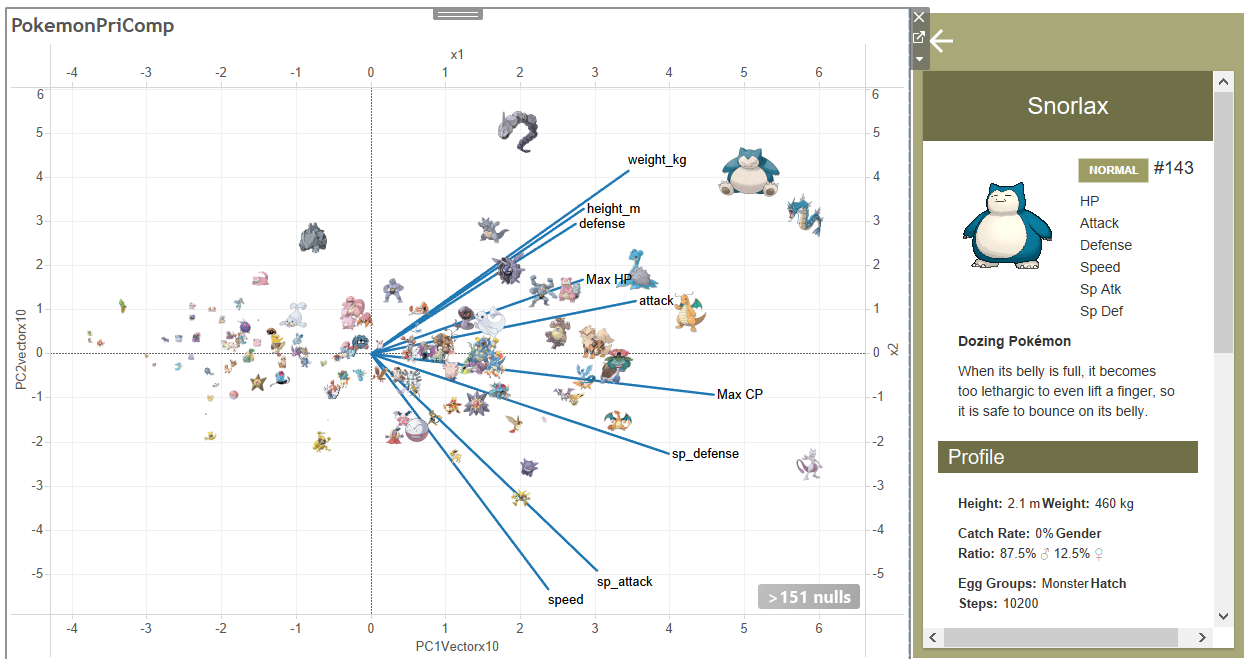
The results of the principal component analysis of 151 first-generation Pokemon and the principal component analysis by Tableau are as follows.
Snorlax, Gyarados, and Onix are similar groups as large, defensive Pokémon.
Looking at the bottom right of the screen, it can be said that speed and sp_attack are similar components. The Pokemon plotted at the bottom right of the screen is small, but it seems to be a Pokemon that has a strong special attack. Gengar and Alakazam have such characteristics.
And there is Mewtwo as a jump value at the bottom right of the screen, but this is not big, but it seems to be extremely strong anyway.
Looking at the whole, the Y axis is big on the top and the defense is high, the bottom is small and awesome
It can be said that the X-axis is stronger overall to the right and weaker overall to the left (MagiCarp Magikarp, Caterpie Caterpie, Weedle Weedle).
In this way, principal component analysis will help you find Pokemon with similar characteristics and Pokemon with outstanding characteristics, making it easier to understand Pokemon from a bird's-eye view.
Next, I would like to introduce the steps involved in the analysis.
- Where to bring the data
Let's actually bring the data and prepare for it.
This time, we will use the following dataset from the data published on Kaggle.
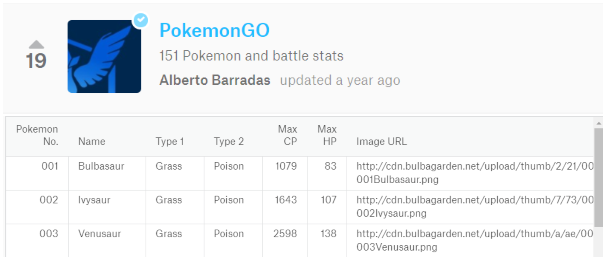
① Pokemon Go: 151 Pokemon and battle stats
There is information on 151 types of first-generation Pokemon MAX CP and MAX HP.
https://www.kaggle.com/abcsds/pokemongo
② The Complete Pokemon Dataset
In addition to the 802 Pokemon attributes, there is a wealth of data such as weight, height, and capture rate. https://www.kaggle.com/rounakbanik/pokemon

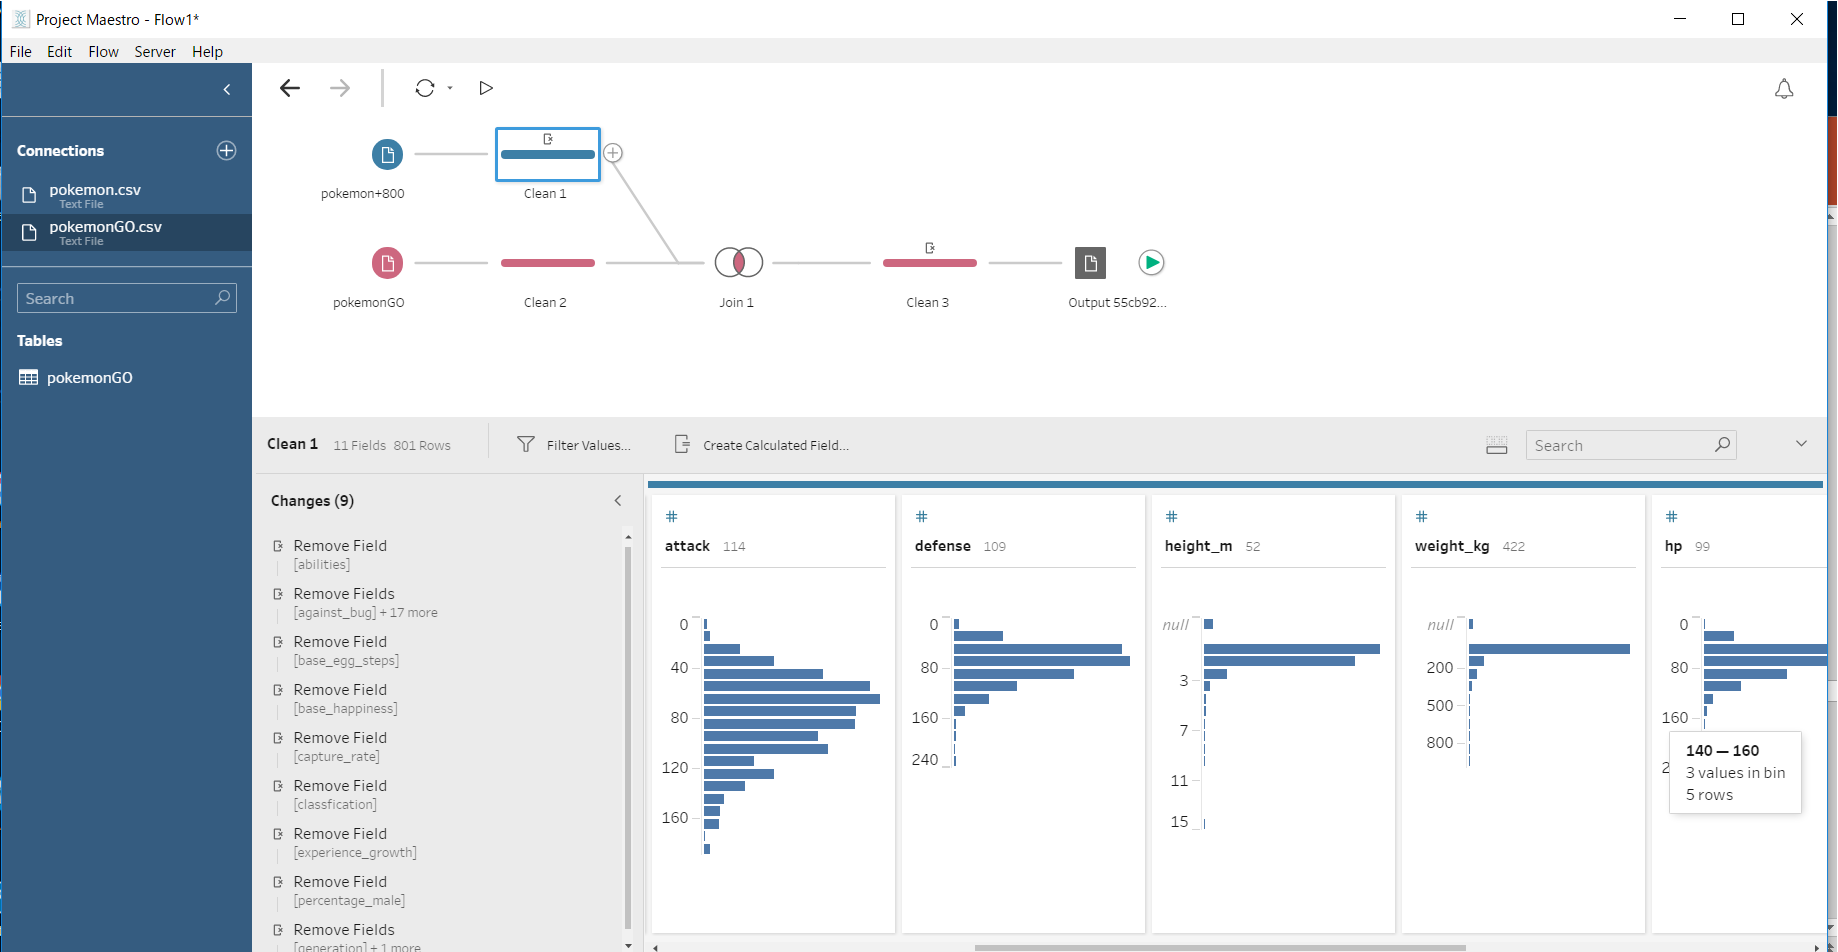
- Prepare data using Tableau Prep
This time, we will prepare the data using Tableau Prep, which is a data preparation tool.
Do the following:
+ Delete unnecessary fields (only necessary fields will be used)
+ Combine two datasets with Pokemon ID (Pokemon-specific ID information is assigned)
+ Deletion of data with missing values (missing Weight) (Principal component analysis cannot be performed if there are missing values, so it is a waste, but I will discard it here.)
- Output the output as CSV.
You can see the distribution of the data in Tableau Prep, so you can see that attack and defense seem to be normally distributed.
- Principal component analysis with R
Now, let's perform principal component analysis with R using the dataset created by Tableau Prep as an input.
Load the data into R and use prcomp to calculate the principal components.
Click here for how to perform principal component analysis with R
http://lovedata.main.jp/2017/09/11/主成分分析(pca)をtableau-とr連携でやってみる/
Please refer to.
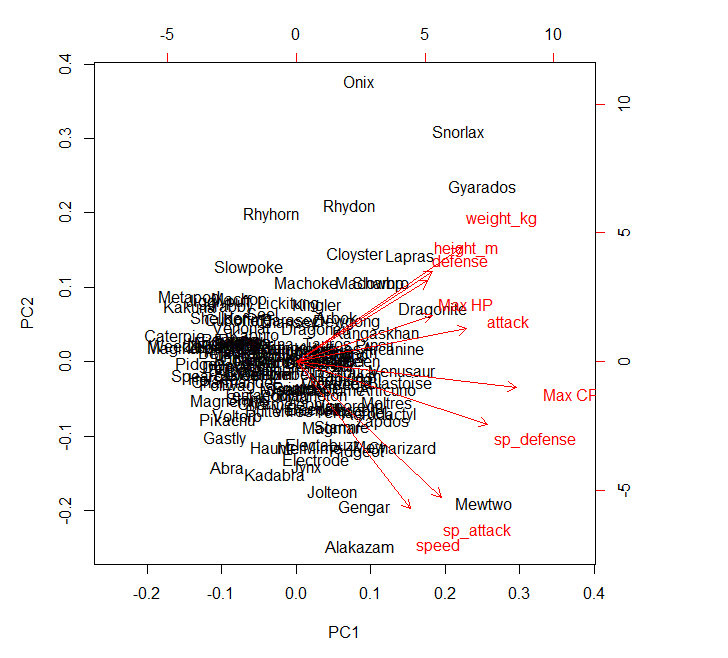
> data <- as.data.frame(PRICOMPdata151) > row.names(data) <- data[,2] > data = data [,3:11] > result = prcomp(data,scale=TRUE) > biplot(result)
First, specify the plot of principal component analysis with R. You could write the plot ... Somehow it is distributed nicely. But with this, you can't see the overlapping characters at all, and you can't highlight the Pokemon you want to see. Let's use Tableau a little more for fun visualizations.
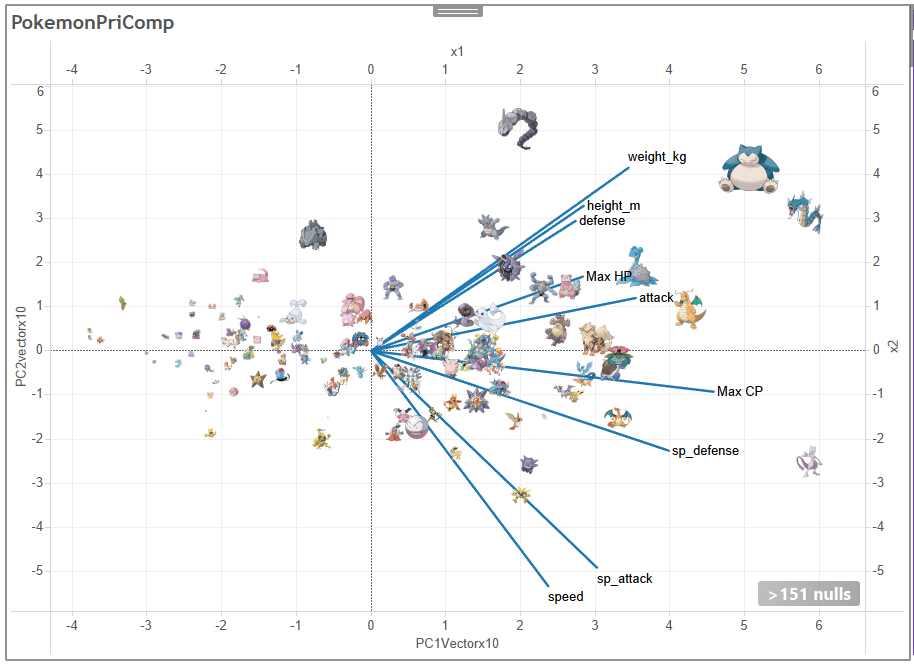
It's exactly the same method as this article introduced earlier, but it adds the principal component data to the original dataset as a new field. You can spit this out into CSV and visualize it from Tableau. > x1 <- result > write.csv(data1,"c:/tmp/Rstudy/Pokemon_pcomp.csv") There is a site called Pokedex.org , and if you pass PokeDex (Pokemon number) to this site, the description of Pokemon will be displayed. .. This is useful. The Pokedex information is already in the dataset, so I'll pass it as a dashboard URL action. You can create a dashboard like this by adding a URL action. See here for how to place Pokemon icons on a scatter plot using a custom shape. Dealing with 718 Pokemon Shapes in Tableau Tableau Public is from here . The more you know about Pokemon, the deeper it is, and it is also interesting as a research subject for data analysis. If you have other interesting ideas about Pokemon, I would like to try analysis. We hope you find this helpful.
Recommended Posts