[PYTHON] What is hyperopt?
Summarize the logic, usage, and verification results of hyperopt
Introduction
When creating a model with machine learning, it is necessary to tune hyper-parameters.
It would be nice if it could be thoroughly investigated by grid search, but if the number of parameters is large like DNN, the amount of calculation will be ridiculous.
It is possible to reduce the amount of calculation by searching for parameters by random search, but the probability of finding the optimum parameters is low.
Therefore, there is a method called Sequential Model-based Global Optimization (SMBO) that efficiently searches for good parameters.
In python, there is a library called hyperopt for using SMBO (it seems that kaggler often uses it ...).
If you search with hyperopt, you can find articles that explain how to use it, but there were not many articles that explained the internal logic and verification ...
Therefore, in this article, we will summarize not only how to use hyperopt, but also the internal logic and verification results. If you just want to use it, skip the first half.
hyperopt logic
What is hyperopt
hyperopt is a python library that efficiently searches parameters for machine learning models.
Among SMBO, hyperopt implements a logic called Tree-structured Parzen Estimator Approach (TPE).
Therefore, in this chapter, after explaining the outline of SMBO, we will briefly explain the calculation method of TPE.
The following two articles were referred to.
-
[Algorithms for Hyper-Parameter Optimization (NIPS, 2011)](https://www.google.co.jp/url?sa=t&rct=j&q=1esrc=s&source=web&cd=3&cad=rja&uact=8&ved=0ahUKEwiqh8GBhffVAhWHiLwKHXKoDQoQFgg9I % 3A% 2F% 2Fwww.lri.fr% 2F ~ kegl% 2Fresearch% 2FPDFs% 2FBeBaBeKe11.pdf & usg = AFQjCNF60kZOogiGZmIBfsuY1Jai4SIVcA]) (TPE paper)
-
http://neupy.com/2016/12/17/hyperparameter_optimization_for_neural_networks.html
In particular, the latter is an English article, but I recommend it because it explains SMBO-> gaussian process-> TPE in an easy-to-understand manner with figures.
Sequential Model-based Global Optimization(SMBO)
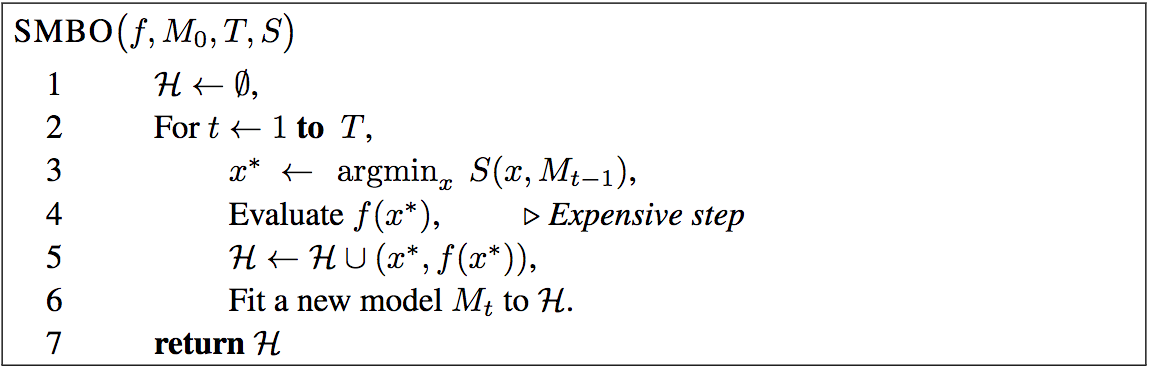
SMBO is one of the frameworks for efficiently searching for model parameters.
The flow of SMBO's Algorithm is as follows.
| Algorithm: SMBO |
|---|
 |
[Algorithms for Hyper-Parameter Optimization](https://www.google.co.jp/url?sa=t&rct=j&q=1esrc=s&source=web&cd=3&cad=rja&uact=8&ved=0ahUKEwiqh8GBhffVAhWHiLwKHXKoDQoQFgg9MAI&url=https% From .lri.fr% 2F ~ kegl% 2Fresearch% 2FPDFs% 2FBeBaBeKe11.pdf & usg = AFQjCNF60kZOogiGZmIBfsuY1Jai4SIVcA])
Explanation of symbols
- $ x $: Parameters
- $ f (x) $: Loss when using parameter $ x $
- $ H $: Set of parameter $ x $ and model loss $ f (x) $ when using that parameter
- $ T $: Number of repeated attempts
- $ M $: A function that takes a parameter $ x $ and predicts the loss $ f (x) $ when using that parameter.
- $ S $: A function that calculates the expected value of how much loss is likely to be reduced when using a parameter $ x $.
The points of SMBO are in the function $ M $ and the function $ S $.
The function $ M $ predicts how much loss is likely to occur when using a parameter $ x $. By using this function $ M $, you can predict how much loss you are likely to lose without having to bother to estimate the model using $ x $. $ M $ can be a model such as linear regression, but the most commonly used is the gaussian process, and hyperopt uses TPE.
The function $ S $ calculates the expected value of how much loss is likely to be reduced when using the parameter $ x $.
For example, let's say you use a parameter $ x $ and predict the accuracy using the function $ M $, with a 50% chance of losing 0.3 and a 50% chance of losing 0.1. In this case, the function $ S $ calculates that the expected loss is $ 0.3 * 0.5 + 0.1 * 0.5 = 0.2 $ when using the parameter $ x $.
You can use the function $ S $ to find the parameter $ x $ that is most likely to reduce losses.
Then, using the estimated parameter $ x $, calculate the model and record how much loss you actually made. In addition, based on this parameter $ x $ and loss $ f (x) $, we update the loss prediction function $ M $.
The outline of SMBO is to repeat this calculation $ T $ times and return the parameter $ x $ with the lowest loss and its loss.
Tree-structured Parzen Estimator Approach(TPE)
TPE is the novelty of hyperopt's original paper, a method of calculating the functions $ M $ and $ S $ described in the previous section.
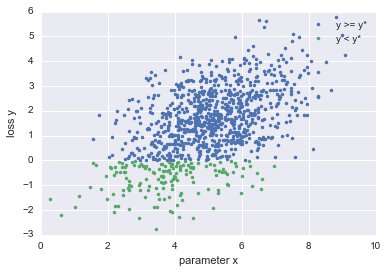
In TPE, first, based on the value of the parameter $ x $, the function $ M $ that calculates the probability that the loss will be $ y $ is calculated as follows.
p(x|y) = \left\{
\begin{array}{ll}
l(x) & (y \lt y^*) \\
g(x) & (y \geq y^*)
\end{array}
\right.
$ y ^ * $ is the threshold, which calculates the distribution $ l (x) $ for parameters less than a loss and the distribution $ g (x) $ for parameters greater than a loss.
Explaining the image of the function $ M $, it looks like the figure below.
| Parameters |
|
|---|---|
 |
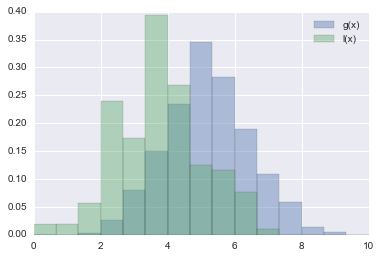 |
By defining the function $ M $ in this way, the distribution of the parameter $ x $ when the loss is smaller than $ y ^ \ * $ and the distribution of the parameter $ x $ when the loss is larger than $ y ^ \ * $ Can be calculated.
In TPE, based on $ l (x) $ and $ g (x) $, the function $ S $ that calculates the expected loss when the parameter $ x $ is selected is defined as follows.
EI_{y^*}(x) = (\gamma + \frac{g(x)}{l(x)}(1 - \gamma))^{-1}
However, $ \ gamma $ is a parameter that determines what percentage of data is set as the threshold $ y ^ \ * $.
To increase this value, $ g (x) $ should be as small as possible and $ l (x) $ should be as large as possible. In other words, the function $ S $ selects the parameter $ x $, which has a higher probability of losing less than the threshold $ y ^ \ * $.
In this way, the TPE searches for the parameter $ x $ to calculate the loss next.
Annotation
In this chapter, I've simplified the logic of hyperopt. So there are some misleading parts. For example, TPE is a method of calculating $ l (x) $ and $ g (x) $ to be exact. If you want to know the exact logic, please [original paper](https://www.google.co.jp/url?sa=t&rct=j&q=1esrc=s&source=web&cd=3&cad=rja&uact=8&ved=0ahUKEwiqh8GBhffVAhWHiLwKHXKoDQoQFgg9MAI&url= Please read% 3A% 2F% 2Fwww.lri.fr% 2F ~ kegl% 2Fresearch% 2FPDFs% 2FBeBaBeKe11.pdf & usg = AFQjCNF60kZOogiGZmIBfsuY1Jai4SIVcA).
How to use hyperopt
This chapter describes how to use hyperopt in python. I referred to the Official Tutorial.
First, import the four modules hp, tpe, Trials and fmin from hyperopt.
from hyperopt import hp, tpe, Trials, fmin
The description of each module is summarized below.
- hp: Used to determine from which distribution the parameters are sampled
- tpe: used to determine whether to do a random search or use tpe logic
- Trials: Create an instance to record the process of hyperopt calculation
- fmin: The function that actually calculates hyperopt
To use hyperopt
- Which parameter to search for
- Which value to minimize
Must be defined in advance.
In order to explain based on a concrete example, let's assume that SVM is used this time.
Definition of parameters to search
In SVM, if the parameters you want to tune are, for example, $ C $, $ gamma $, $ kernel $, first define the parameters to be searched in the dictionary type or list type as follows.
hyperopt_parameters = {
    'C': hp.uniform('C', 0, 2),
    'gamma': hp.loguniform('gamma', -8, 2),
    'kernel': hp.choice('kernel', ['rbf', 'poly', 'sigmoid'])
}
hp.uniform is a function for sampling parameters from a uniform distribution, specifying the parameter names, min, max.
hp.loguniform searches for parameters in the range $ exp (min) $ to $ exp (max) $. Therefore, for parameters such as $ C $ and $ gamma $ of SVM that are suitable to be searched in the range of $ 10 ^ {-5} $ to $ 10 ^ {2} $, hp.loguniform It is better to use (we will verify in a later chapter).
hp.choice can sample categories. This function is a good choice when choosing an SVM kernel.
You can specify a distribution other than the one shown here. For more information, see Official Tutorial (https://github.com/hyperopt/hyperopt/wiki/FMin).
Definition of the value to minimize
In hyperopt, you need to define what to minimize as a function.
For SVM, the function definition is as follows.
def objective(args):
    #Model instantiation
    classifier = SVC(**args)
    #Model training using train data
    classifier.fit(x_train, y_train)
    #Label prediction using validation data
    predicts = classifier.predict(x_test)
    #Calculate micro f1 using predictive label and correct label
    f1 = f1_score(y_test, predicts, average='micro')
    #This time I want to maximize the micro f1 so-Multiply by 1 to minimize
    return -1*f1
The argument ʻargs contains the hyperopt_parameters` defined in the previous section.
In this example, we first set the defined parameters to create an instance of SVM.
Next, we train the model using the train data.
Use the trained model to predict the label of validation data.
This time, the purpose is to find the parameter that maximizes the micro f1, and the micro f1 of the validation data is calculated.
It returns the last calculated micro f1, but note that hyperopt only supports minimization. Therefore, when finding the parameter that maximizes the value like this time, multiply it by -1 and return it.
calculation of hyperopt
Search for parameters using the predefined hyperopt_parameters and def objective.
Search for parameters by doing the following.
#Number of iterations
max_evals = 200
#An instance that records the process of the trial
trials = Trials()

best = fmin(
    #A function that defines the value to minimize
    objective,
    #Dict or list of parameters to search
    hyperopt_parameters,
    #Which logic to use, basically tpe.suggest ok
    algo=tpe.suggest,
    max_evals=max_evals,
    trials=trials,
    #Output trial process
    verbose=1
)
By passing hyperopt_parameters and def objective to the function fmin, parameters are searched, but in addition to that, the instance trials for recording the calculation result, how many times to search It also specifies the max_evals to specify.
By calculating in this way, the parameters that minimize obejctive are calculated.
In the above example, the contents of best are as follows.
$ best
>> {'C': 1.61749553623185, 'gamma': 0.23056607283675354, 'kernel': 0}
Also, use trials to check the actually calculated value of micro f1 and the value of the parameter you tried.
$ trials.best_trial['result']
>> {'loss': -0.9698492462311558, 'status': 'ok'}

$ trials.losses()
>> [-0.6700167504187605, -0.9095477386934674, -0.949748743718593, ...]

$ trials.vals['C']
>> [2.085990722493943, 0.00269991295234128, 0.046611673333310344, ...]
Accuracy verification of hyperopt
The contents verified this time are mainly the following two.
- Which is better to use,
hp.loguniformorhp.uniform? - Is hyperopt more accurate than random search?
The dataset used is digits (64-dimensional handwritten digit data) in sklearn. We used 1200 train data and the rest as validation data.
For the classifier, we used sklearn's SVC. The searched parameters are $ C $, $ gamma $, and $ kernel $, which were shown in the concrete examples in the previous chapter.
The code used for verification is https://github.com/kenchin110100/machine_learning/blob/master/sampleHyperOpt.ipynb It is in.
LogUniform vs Uniform
In the previous chapter, I wrote that it is better to use hp.loguniform in the case of SVC, but I verified whether it really is.
As a verification method, LogUniform and Uniform were searched for 50 iterations 100 times each, and the best estimated distribution of micro f1 values was compared.
Each `hyperopt_parameters was set as follows.
hyperopt_parameters_loguniform = {
    'C': hp.loguniform('C', -8, 2),
    'gamma': hp.loguniform('gamma', -8, 2),
    'kernel': hp.choice('kernel', ['rbf', 'poly', 'sigmoid'])
    }

hyperopt_parameters_uniform = {
    'C': hp.uniform('C', 0, 10),
    'gamma': hp.uniform('gamma', 0, 10),
    'kernel': hp.choice('kernel', ['rbf', 'poly', 'sigmoid'])
    }
The results of the comparison are summarized in the figure below.
| LogUniform vs Uniform |
|---|
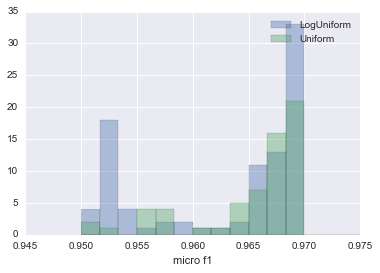 |
The histogram of the LogUnifrom result is blue, and the histogram of the Uniform result is green. Although LogUniform is more likely to estimate a lower micro f1, it has nearly doubled the number of times it recorded 0.96985, the largest micro f1 home this time around.
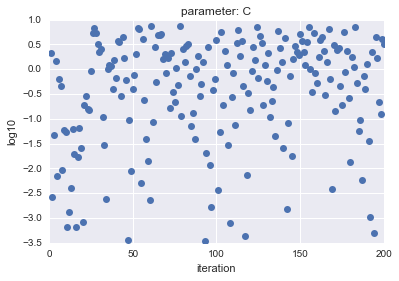
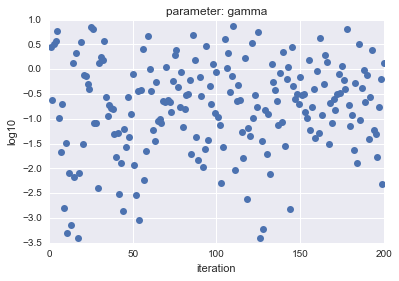
In the case of LogUniform, in the case of Uniform, the sample parameters $ C $ and $ gamma $ are plotted and the result is as follows.
- For Log Uniform
| parameter |
parameter |
|---|---|
 |
 |
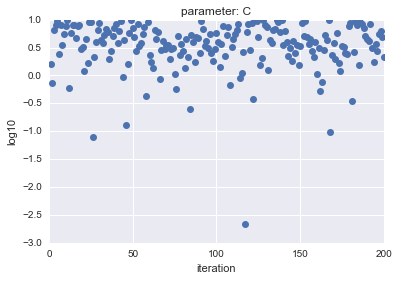
- For Uniform
| parameter |
parameter |
|---|---|
 |
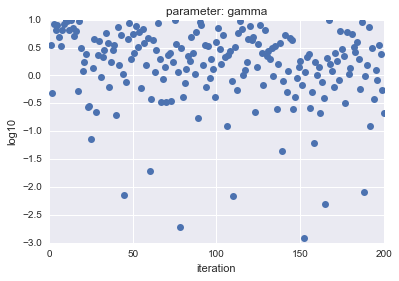 |
The horizontal axis shows iteration, and the vertical axis shows logarithmic $ C $ and $ gamma $ values.
As you can see, LogUniform has a more even sample from the whole. By being able to sample evenly from the whole, it is more likely that you will be able to search for parameters that are more accurate (although it is more likely that they will be lower ...).
HyperOpt vs RandomSearch
Next, we examined which of the cases where HyperOpt was used and the parameters were estimated by RandomSearch was more likely to be able to estimate the parameters with higher accuracy.
The data set used and the experimental conditions are the same as those in the previous section. We estimated 100 times each with HyperOpt and RandomSearch, and compared the frequency of the best micro f1 values obtained.
The results of the comparison are summarized in the figure below.
| HyperOpt vs RansomSearch |
|---|
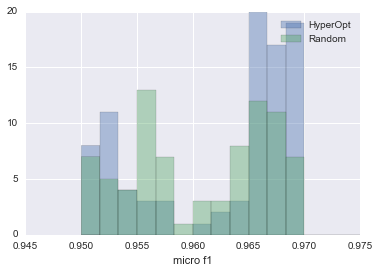 |
The blue one is HyperOpt and the green one is Random Search. As you can see, HyperOpt is more than twice as likely to be able to estimate parameters that produce a micro f1 value of 0.965 or higher.
This shows that it is better to use HyperOpt than RandomSearch.
Additional experiments
Even though HyperOpt is more accurate than RandomSearch, it takes longer to calculate, isn't it? In order to verify the question, we compared the calculation time. We turned 200 iterations each and measured the time taken.
#HyperOpt calculation time
%timeit hyperopt_search(200)
>> 1 loop, best of 3: 32.1 s per loop

#Random Search calculation time
%timeit random_search(200)
>> 1 loop, best of 3: 46 s per loop
Well, rather, hyperopt is faster ... Since RandomSearch was implemented by myself, there may be a problem with my coding, but it seems that hyperopt is actually coded so that it will be automatically distributed. So, even if you use hyperopt, it seems that you can calculate at the same speed as or faster than random search.
Summary
This time, we verified the logic, usage, and accuracy of python hyperopt.
After all, it seems better to use hyperopt than to tune the parameters with Random Search.
I wrote it like the strongest TPE, but there seems to be a problem with TPE (ignoring the dependency between variables, etc.).
Still, hyperopt has the advantage that it can be used with sklearn and xgboost, so I will use it a lot from now on.
Recommended Posts