Get coordinate values and keyboard input values by clicking on the python / matplotlib diagram
There are times when you want to display data with matplotlib on python or jupyter and analyze it manually with a mouse, range specification, value acquisition, etc. Also, I'm sorry for the appropriate sentence, but it is a memo at that time. I use it to handle astronomical data and music code, but it is useful when I want to create a data analysis tool with a suitable GUI like that. This is the reference page. http://matplotlib.org/users/event_handling.html
In the case of jupyter, it is not possible to do% matplotlib inline, so please use it as it is or% matplotlib notebook.
Preparation
import numpy as np
import pylab
import matplotlib.pyplot as plt
- Mouse click and get data
def onclick(event):
    print 'event.button=%d,  event.x=%d, event.y=%d, event.xdata=%f, \
    event.ydata=%f'%(event.button, event.x, event.y, event.xdata, event.ydata)
Let's display the appropriate x, y array data
fig=plt.figure()
ax=fig.add_subplot(111)
ax.plot(x,y)
cid = fig.canvas.mpl_connect('button_press_event', onclick)
plt.show()
Click the figure with the mouse
event.button=1,  event.x=234, event.y=229, event.xdata=496.774194, event.ydata=1.011211
event.button=1,  event.x=257, event.y=182, event.xdata=570.967742, event.ydata=1.005703
event.button=1,  event.x=193, event.y=135, event.xdata=364.516129, event.ydata=1.000195
event.button=3,  event.x=193, event.y=135, event.xdata=364.516129, event.ydata=1.000195
It will display the button number and position you clicked like this. If you left-click, event.button = 1, 2 in the middle, and 3 on the right.
This event.xdata is the value of x, so let's find the corresponding index in the array and plot it with a red dot so that the index appears in the title. For this, you can use np.searchsorted, which will give you the index to the right of that value.
def oncpaint(event):
    ind=np.searchsorted(x,event.xdata)
    plt.title("You clicked index="+str(ind))
    ax.plot([x[ind]],[y[ind]],".",color="red")
    fig.canvas.draw()
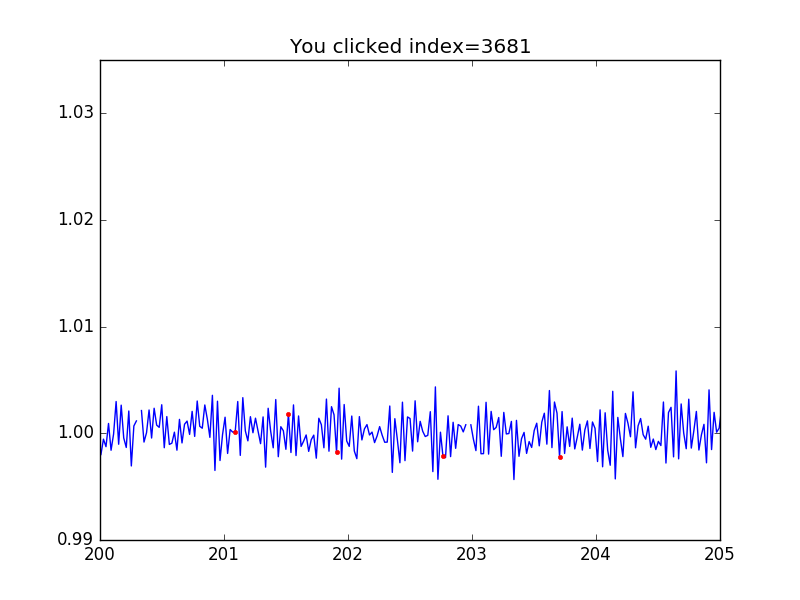
Is there a clicked index in the title? Basically, you can get information interactively like this. It looks like Lego. Now are you using a mac now? Doesn't the mac have only one button and give too much priority to fashion? so. I want to do various operations such as enlargement by left-clicking (event.button = 1), and I want to do the operations I defined with other buttons. So you can use a cheap mouse, and then connect the one with 3 buttons.
Next, let's make something like this.
- Prepare all true masks
- Right-click and select a point twice to mark between the two points
- Left double-click to confirm, middle button to cancel
- The mask of the determined mark part becomes false
All true masks
mask=np.ones(len(x),dtype=bool)
Definition part of the above operation
def oncmask(event):
    global stat
    global leftind, rightind
    ind=np.searchsorted(x,event.xdata)
    plt.title("You clicked index="+str(ind))
    if event.button==3 and stat==1:
        leftind=ind
        ax.plot([x[ind]],[y[ind]],".",color="red")
        stat=2
    elif event.button==3 and stat==2:
        rightind=ind
        ax.plot(x[leftind:rightind],y[leftind:rightind],color="red")
        stat=3
        print leftind, rightind
    elif event.button==1 and event.dblclick==1 and stat==3:
        plt.title("Approved")
        mask[leftind:rightind]=False
        stat=1
    elif event.button==2 and stat==3:
        plt.title("Canceled")
        ax.plot(x[leftind:rightind],y[leftind:rightind],color="blue")
        ax.plot([x[leftind]],[y[leftind]],".",color="green")
        stat=1
    fig.canvas.draw()
Right-click twice to select an area, then double-click left to Approve! Press the middle button to start over. Like this

Let's check if it was masked
fig=plt.figure()
ax=fig.add_subplot(111)
plt.xlim(200,205)
ax.plot(x[mask],y[mask])
plt.show()

It has been done.
- Get keyboard value
You can also get keyboard input values. Let's erase it with flush this time.
import sys
Definition part. I set it to end when I press q.
def onkey(event):
    print('you pressed', event.key, event.xdata, event.ydata)
    if event.key == 'q':
        plt.close(event.canvas.figure)
    sys.stdout.flush()
Take out the figure and try to use the keyboard on the figure.
fig=plt.figure()
ax=fig.add_subplot(111)
plt.xlim(200,205)
plt.title("q:quit")
ax.plot(x,y)
cid = fig.canvas.mpl_connect('key_press_event', onkey)
plt.show()
It looks like this.
('you pressed', u'a', 201.38104838709677, 1.0182421874999998)
('you pressed', u'b', 201.38104838709677, 1.0182421874999998)
('you pressed', u'c', 201.38104838709677, 1.0182421874999998)
('you pressed', u'shift', 201.33064516129031, 1.0173046875)
('you pressed', u'A', 201.33064516129031, 1.0173046875)
('you pressed', u'shift', 201.32056451612902, 1.0168359375)
('you pressed', u'R', 201.32056451612902, 1.0164843749999999)
('you pressed', u'q', 201.21975806451613, 1.0033593750000001)
See you soon.
Postscript:
func.py
def oncpaint(event):
    ind=np.searchsorted(x,event.xdata)
    ax.plot([x[ind]],[y[ind]],".",color="red")
    fig.canvas.draw()
main.py
import builtins

builtins.x=np.linspace(0,1,100)
builtins.y=np.cos(x)
builtins.fig=plt.figure()
ax=fig.add_subplot(111)
ax.plot(x,y)
cid = fig.canvas.mpl_connect('button_press_event', onclick)
plt.show()
If you want to write this in a separate file and call it with a module, you may want to make x or fig a built-in scope with builtins at the call destination (please tell me if there is a better way).
Recommended Posts