Let's use the open data of "Mamebus" in Python
The Kusatsu City City Planning and Transportation Policy Division is converting the Kusatsu City community bus "Mame Bus" into open data. http://www.city.kusatsu.shiga.jp/kurashi/kotsudorokasen/mamebus/opendata.html
Here, I will handle the data of this "Mame Bus". The purpose is to automatically download all the data and properly build the DataBase to make the bus data available on the web. At this time, Excel data shall be analyzed not only on Windows but also on Linux.
This makes it possible to automatically use the latest data on many rental servers (within certain changes) without human intervention.
demo http://needtec.sakura.ne.jp/bus_data/kusatu.html

Github https://github.com/mima3/bus_data
Download the data with the following command and build the DB.
python import.py application.ini
If the data is updated, you can use this command to get the latest data. It's a good idea to run it regularly with cron.
Data description
Each line consists of the following three configurations.
| name | format | Description |
|---|---|---|
| time table | Excel | It is the data that describes the arrival time of each bus station. Arrival times may vary depending on weekdays, Saturdays and days of the week |
| Bus stop | csv | Bus stopの名前、読み、座標が格納されたCSVデータです。 There may be multiple data, clockwise and counterclockwise, on the same route. |
| route map | shape | route mapの形状を表したshapeファイルです。この測地系は「平面直角2000(6 series)Please note that. There may be multiple data, clockwise and counterclockwise, on the same route. |
There are a few things to keep in mind when working with data.
There are multiple bus stops with the same bus stop name.
There are multiple bus stops with the same name.
For example, take a look at M04_stops_ccw.csv. There are two lines at Nomura Sports Park Exit. The Nomura Sports Park Exit at 135.954709,35.023382 and the Nomura Sports Park Exit at 135.954445,35.023323.
Buses in the same position stop multiple times on the same route
Even if the bus stops are in the same position, they may stop multiple times on the same route.
For example, take a look at M04_stops_ccw.csv. The west exit of Kusatsu Station stops at the 1st and 37th stops.
The stop order is listed in the second row of CSV.
Fluctuation of CSV and Excel notation
The bus stop name may be different between Excel and CSV. There are some that have different names, such as line breaks, half-width and full-width differences.
| csv | excel |
|---|---|
| In front of Yamada Elementary School | Yamada Elementary School |
| Kinokawa East | Kikawahigashi |
| Nishishibukawa 1-chome | Nishishibukawa 1-chome |
| Nomura 8-chome | Nomura 8-chome |
| In front of Shindo Junior High School | Shindo Junior High School |
Inconsistent way of expressing days of the week in timetables
Normally, the data arrangement in Excel will be the same, but it will be different for each workbook.
Take a look at M01_stop_times.xlsx.

In this workbook, the presence or absence of "●" determines whether it is a Saturday or a weekday. But let's take a look at another M03_stop_times.xlsx.
Here, the days of the week are divided for each sheet.
| Book name | How to determine the day of the week |
|---|---|
| M01_stop_times.xlsx | Judgment by ● |
| M02_stop_times.xlsx | Judgment by ● |
| M03_stop_times.xlsx | Sheet split |
| M04_stop_times.xlsx | Sheet split |
| M05_stop_times.xlsx | No mention of day of the week |
As you can guess from this, it's best to assume that the data starting position is different for each book.
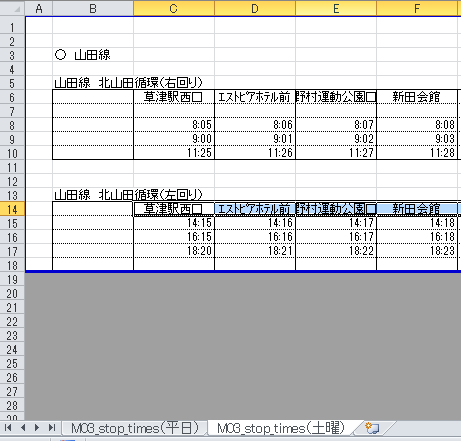
Blank line between bus stop name and time
Since the time is entered from the next line of the bus stop name, you may want to search from there and judge that the timetable is over if all the lines are blank.
However, it cannot. Let's take a look at the Yamada Line (Kinokawa circulation: counterclockwise) of M04_stop_times.xlsx. The next line of the bus stop name is a blank space, and the data starts from the next line.
Non-extensible data placement
In the case of the following sheet, even if the number of buses increases, the amount of data simply changes, so there is no change in the process of analyzing Excel.
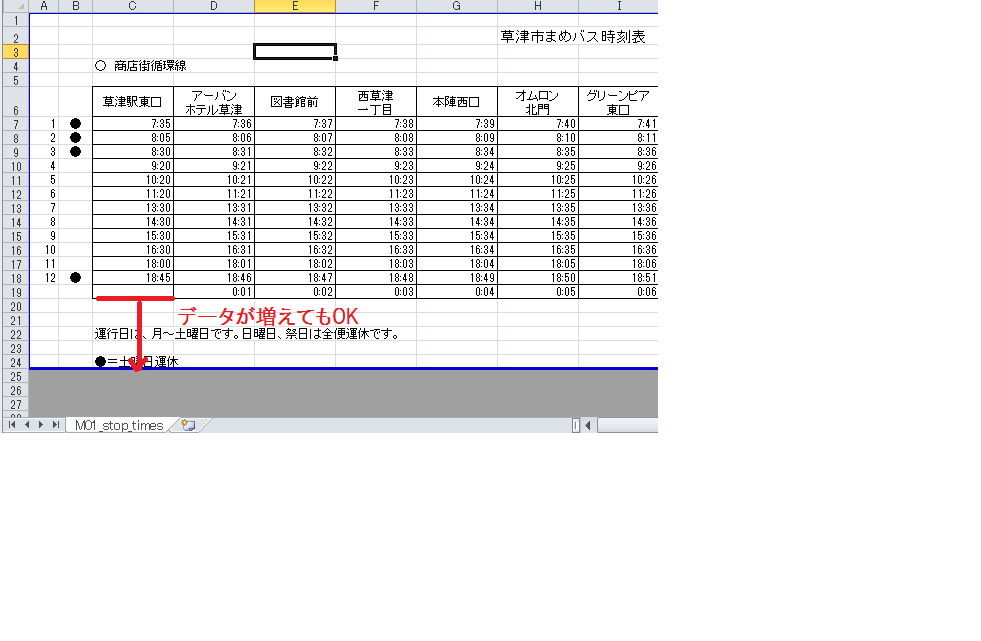
But consider the next line.

In this example, as the amount of data increases, the data start position at the bottom also shifts, so it is necessary to change the processing.
Examples handled by Python
Handle Excel files
To work with Excel in Python, use xlrd. https://github.com/python-excel/xlrd
Some samples using this library will come out when you google, but basically it is better to create it by referring to the official sample code.
https://github.com/python-excel/xlrd/blob/master/scripts/runxlrd.py
For example, the following implementation examples are common.
from xlrd import open_workbook
wb = open_workbook('test_err.xlsx')
for sh in wb.sheets():
  for row in range(sh.nrows):
    values = []
    for col in range(sh.ncols):
      v = sh.cell(row,col).value
      if not isinstance(v, basestring):
        v = str(v)
      v = v + ':' + str(sh.cell(row,col).ctype)
      values.append(v)
    print ','.join(values)
The above code works fine with xLS extensions and xlsx without cell merging. However, if you operate a sheet that has the following cell merge, an error will occur.
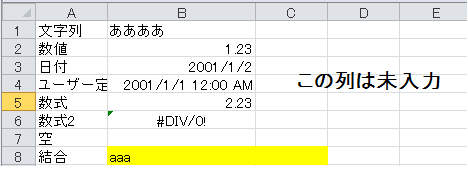
error contents
Traceback (most recent call last):
  File "test2.py", line 7, in <module>
    v = sh.cell(row,col).value
  File "C:\Python27\lib\site-packages\xlrd-0.9.3-py2.7.egg\xlrd\sheet.py", line
399, in cell
    self._cell_types[rowx][colx],
IndexError: array index out of range
Apparently, the number of columns is different for each row, and I need to get the number of columns for each row. You can avoid this problem by getting the number of columns for each row with row_len as shown below.
from xlrd import open_workbook
wb = open_workbook('test_err.xlsx')
for sh in wb.sheets():
  for row in range(sh.nrows):
    values = []
    for col in range(sh.row_len(row)):
      v = sh.cell(row,col).value
      if not isinstance(v, basestring):
        v = str(v)
      v = v + ':' + str(sh.cell(row,col).ctype)
      values.append(v)
    print ','.join(values)
In addition, the date display method is also implemented in runxlrd.py, so you should read it once for the time being.
How to capture data
As mentioned earlier, there are sections that make Excel in the mood, so it is necessary to respond flexibly to each. Therefore, I saved how to import the data in the JSON configuration file and tried to import the data by looking at it.
https://github.com/mima3/bus_data/blob/master/data/kusatu.json
Branching of processing after download
This time, compressed data and uncompressed data are mixed. Therefore, the processing after download is described in the download of the setting file.
data/kusatu.json
    "download" : {
        "http://www.city.kusatsu.shiga.jp/kurashi/kotsudorokasen/mamebus/opendata.files/M01_stop_times.xlsx" : "save_local",
        "http://www.city.kusatsu.shiga.jp/kurashi/kotsudorokasen/mamebus/opendata.files/M01_stops_ccw.csv" : "save_local",
        "http://www.city.kusatsu.shiga.jp/kurashi/kotsudorokasen/mamebus/opendata.files/M01_shapes.zip" : "expand_zip",
save_local saves to the local disk. expand_zip executes the process of trying to unzip after saving.
See below for the actual code. https://github.com/mima3/bus_data/blob/master/downloader.py
Corresponds to the fluctuation of CSV and EXCEL notation
Corresponds to fluctuations in CSV and Excel notation.
The basic rules are as follows. ・ Convert the bus station name according to the convert_rule of the configuration file ・ Remove line breaks ・ Change half-width to full-width.
** Bus stop name conversion **
data/kusatu.json
    "convert_rule" : {
        "In front of Yamada Elementary School": "Yamada Elementary School",
        "Kinokawa East":"Kikawahigashi",
        "Nishishibukawa 1-chome": "Nishishibukawa 1-chome",
        "Nomura 8-chome": "Nomura 8-chome",
        "In front of Shindo Junior High School": "Shindo Junior High School"
    },
bus_data_parser.py
def convert_bus_stop_name(rule, bus_stops):
    for bus_stop in bus_stops:
        if bus_stop['stopName'] in rule:
            bus_stop['stopName'] = rule[bus_stop['stopName']
** Remove line breaks and change half-width characters to full-width characters **
bus_data_parser.py
def get_bus_timetable(wbname, sheetname, stop_offset_row, stop_offset_col, stopdirection, timetable_offset_row, timetable_offset_col, chk_func):
    xls = xlsReader(wbname, sheetname)
    stop_name_list = []
    if stopdirection == DataDirection.row:
        busdirection = DataDirection.col
    else:
        busdirection = DataDirection.row
    xls.set_offset(stop_offset_row, stop_offset_col)
    while True:
        v = xls.get_cell()
        if not v:
            break
        v = zenhan.h2z(v)
        v = v.replace('\n', '')
        stop_name_list.append(v)
        xls.next_cell(stopdirection)
Zenhan is used for half-width and full-width conversion. https://pypi.python.org/pypi/zenhan
Description of import rules for CSV, EXCEL, Shape files
Specify how to import each file as follows.
    "import_rule" : [
        {
            "operation_company" : "Kusatsu City",
            "line_name" : "Shopping street circulation line",
            "shape" : "M01_shapes/M01.shp",
            "srid" : 2448 ,
            "timetables" : [
                {
                    "route" : "Route1L",
                    "routeName" : "Shopping street circulation line",
                    "bus_stops" : "M01_stops_ccw.csv",
                    "weekday_timetable" : {
                        "workbook" : "M01_stop_times.xlsx",
                        "sheetname" : "M01_stop_times",
                        "stop_offset_row" : 6,
                        "stop_offset_col" : 3,
                        "timetable_offset_row" : 7,
                        "timetable_offset_col" : 3
                    },
                    "saturday_timetable" : {
                        "workbook" : "M01_stop_times.xlsx",
                        "sheetname" : "M01_stop_times",
                        "stop_offset_row" : 6,
                        "stop_offset_col" : 3,
                        "timetable_offset_row" : 7,
                        "timetable_offset_col" : 3,
                        "check_func" : "check_shoutengai_saturday"
                    },
                    "holyday_timetable" : {
                    }
                }
            ]
        }, //Abbreviation
        {
            "operation_company" : "Kusatsu City",
            "line_name" : "Yamada Line (Kitayamada Circulation)",
            "shape" : "M03_shapes/M03.shp",
            "srid" : 2448 ,
            "timetables" : [
                {
                    "route" : "Route3R",
                    "routeName" : "Kitayamada circulation line clockwise",
                    "bus_stops" : "M03_stops_cw.csv",
                    "weekday_timetable" : {
                        "workbook" : "M03_stop_times.xlsx",
                        "sheetname" : "M03_stop_times (weekdays)",
                        "stop_offset_row" : 6,
                        "stop_offset_col" : 3,
                        "timetable_offset_row" : 7,
                        "timetable_offset_col" : 3
                    },
                    "saturday_timetable" : {
                        "workbook" : "M03_stop_times.xlsx",
                        "sheetname" : "M03_stop_times (saturday)",
                        "stop_offset_row" : 6,
                        "stop_offset_col" : 3,
                        "timetable_offset_row" : 7,
                        "timetable_offset_col" : 3
                    },
                    "holyday_timetable" : {
                    }
                },
                {
                    "route" : "Route3L",
                    "routeName" : "Kitayamada circulation line counterclockwise",
                    "bus_stops" : "M03_stops_ccw.csv",
                    "weekday_timetable" : {
                        "workbook" : "M03_stop_times.xlsx",
                        "sheetname" : "M03_stop_times (weekdays)",
                        "stop_offset_row" : 14,
                        "stop_offset_col" : 3,
                        "timetable_offset_row" : 15,
                        "timetable_offset_col" : 3
                    },
                    "saturday_timetable" : {
                        "workbook" : "M03_stop_times.xlsx",
                        "sheetname" : "M03_stop_times (saturday)",
                        "stop_offset_row" : 14,
                        "stop_offset_col" : 3,
                        "timetable_offset_row" : 15,
                        "timetable_offset_col" : 3
                    },
                    "holyday_timetable" : {
                    }
                }
            ]
        }, //Abbreviation
Related to shapefiles are "shape" and "srid". Describe the shape file name in shape and the geodetic system in srid.
Related to the csv file is "bus_stops". Describe the CSV file name in bus_stops.
Excel files are listed on weekdays, Saturdays, and holidays. Workbook name in workbook Sheet name in sheetname stop_offset_row, start position where the bus stop name is written in stop_offset_col, Describe the start position where the time is described in timetable_offset_row and timetable_offset_col. check_func is an optional item that specifies the callback function that will be executed each time a line of timetable is read.
Here, the value of a specific column is checked as shown below, and if the data is invalid, False is returned and the row is ignored. This is used for the judgment on Saturday.
import.py
class BusParserCallBack(object):
    def check_shoutengai_saturday(self, workbook, sheet, busrow, buscol, item):
        if sheet.cell(busrow  - 1, 2 - 1).value:
            return True
        else:
            return False
Handling of Shape files
For Python, it's a good idea to use pyshp. Please refer to the following.
** Try to import the land numerical information ShapeFile into the database with Python ** http://qiita.com/mima_ita/items/e614a281807970427921
Geodetic system conversion
The geodetic system of the shape file of Mamebus is "plane right angle 2000 (6 system)", and SRID is 2448. This must be converted into a world geodetic system. This conversion is quite annoying, but it can be easily handled with a DB that handles geometry such as SpatiaLite.
In the case of Spatialite, you can return it by executing the following SQL.
select AsText(Transform(GeomFromText('POINT(-4408.916645 -108767.765479)', 2448), 4326))
The python code looks like this:
bus_db.py
        for timetable in timetables:
            database_proxy.get_conn().execute(
                """
                INSERT INTO RouteTable
                  (metaData_id, operationCompany, lineName, route, routeName, geometry)
                VALUES(?, ?,?,?,?,Transform(GeometryFromText(?, ?),?))
                """,
                (
                    meta_id,
                    operation_company,
                    line_name,
                    timetable['route'],
                    timetable['routeName'],
                    routedict[timetable['route']], src_srid, SRID
                )
            )
Summary
In this way, if you use the Python library, you can use the data of "Mamebus" without being aware of it.
However, the data is quite quirky and is not structured to assume mechanical analysis, so you will have a hard time there.
If you want to make it easier to handle data with a machine and improve the data side, I think the following points are necessary. -Make data consistency between different files such as CSV and Excel ・ Unify the format as it is unavoidable to use Excel ・ Consider when the amount of data increases.
Recommended Posts