[PYTHON] I want to acquire and list Japanese stock data without scraping
I want to handle large data!
Analyzing stock prices looks interesting!
When I think about it and look it up, overseas stocks can be obtained as data unexpectedly easily with Pandas' DataReader, but (For example, Google finance or FRED) Japanese stock prices cannot be found as unexpected data.
You just have to pull it from Yahoo! Finance! There are many articles, Yahoo! Finance [Prohibits scraping](https://www.yahoo-help.jp/app/answers/detail/p/546/a_id/93575/~/yahoo%21%E3%83%95%E3% 82% A1% E3% 82% A4% E3% 83% 8A% E3% 83% B3% E3% 82% B9% E6% 8E% B2% E8% BC% 89% E6% 83% 85% E5% A0% B1% E3% 81% AE% E8% 87% AA% E5% 8B% 95% E5% 8F% 96% E5% BE% 97% EF% BC% 88% E3% 82% B9% E3% 82% AF% E3% 83% AC% E3% 82% A4% E3% 83% 94% E3% 83% B3% E3% 82% B0% EF% BC% 89% E3% 81% AF% E7% A6% 81% E6% AD% A2% E3% 81% 97% E3% 81% A6% E3% 81% 84% E3% 81% BE% E3% 81% 99), so I can't pull it from here.
You might argue that you can use the module jsm, but this one also uses scraping.
The purpose of this article is to ** get data without scraping and make it into one list **.

Code for impatient people
Please tell me only the conclusion! I'll keep the code for people (I did my best). Please correct the details by yourself.
Code 1
import os
import pandas as pd
import matplotlib.pyplot as plt

os.chdir("C:\\Users\\Kuma_T\\stock") #Specify the location of the file and put the data first

plt.rcParams['figure.figsize'] = [10, 5]
plt.rcParams['xtick.direction'] = 'in'#x-axis scale line pointing inward('in')Or outward('out')Or bidirectional('inout')
plt.rcParams['ytick.direction'] = 'in'#y-axis scale line pointing inward('in')Or outward('out')Or bidirectional('inout')
plt.rcParams['xtick.major.width'] = 1.0 #Line width of x-axis main scale line
plt.rcParams['ytick.major.width'] = 1.0 #Line width of y-axis main scale line
plt.rcParams['font.size'] = 12 #Font size
plt.rcParams['axes.linewidth'] = 1.0 #Axis line width edge linewidth. Enclosure thickness
plt.rcParams['font.family'] =  'Times New Roman' #Font name to use
Code 2
code = 3672 #Altplus
start = 2015
end = 2017

x = []
y = []

for n in range (start, end+1):
    file_name = 'stocks_'+str(code)+'-T_1d_%d.csv' %n #Specify the file name
    data =  pd.read_csv(file_name, header=0, encoding='cp932') #I can't read Japanese, so specify encoding
    a =list(pd.to_datetime(data.iloc[:,0], format='%Y-%m-%d')) #If you read it as it is, the date cannot be recognized, so use datetime
    x += a[::-1] #To reverse the order in the list[::-1]And add to the list of x
    b = list(data.iloc[:,4])
    y += b[::-1]

z = pd.DataFrame(y)#Convert to DataFrame
sma75 = pd.DataFrame.rolling(z, window=75,center=False).mean()
sma25 = pd.DataFrame.rolling(z, window=25,center=False).mean()

plt.plot(x, y, color="blue", linewidth=1, linestyle="-")
plt.plot(x, sma25, color="g", linewidth=1, linestyle="-", label="SMA25")
plt.plot(x, sma75, color="r", linewidth=1, linestyle="-", label="SMA75")

plt.title("Alt Plus ("+str(code)+")", fontsize=16,  fontname='Times New Roman')
plt.xlabel("Year-Month", fontsize=14, fontname='Times New Roman') #x-axis title
plt.ylabel("Stock price", fontsize=14, fontname='Times New Roman') #y-axis title

plt.legend(loc="best")

plt.show()
Data preparation
Individual stock price data http://k-db.com/stocks/
If you access here, you can get the data of Japanese stocks as a CSV file.
If you take a look at AltPlus (3672) as a test,
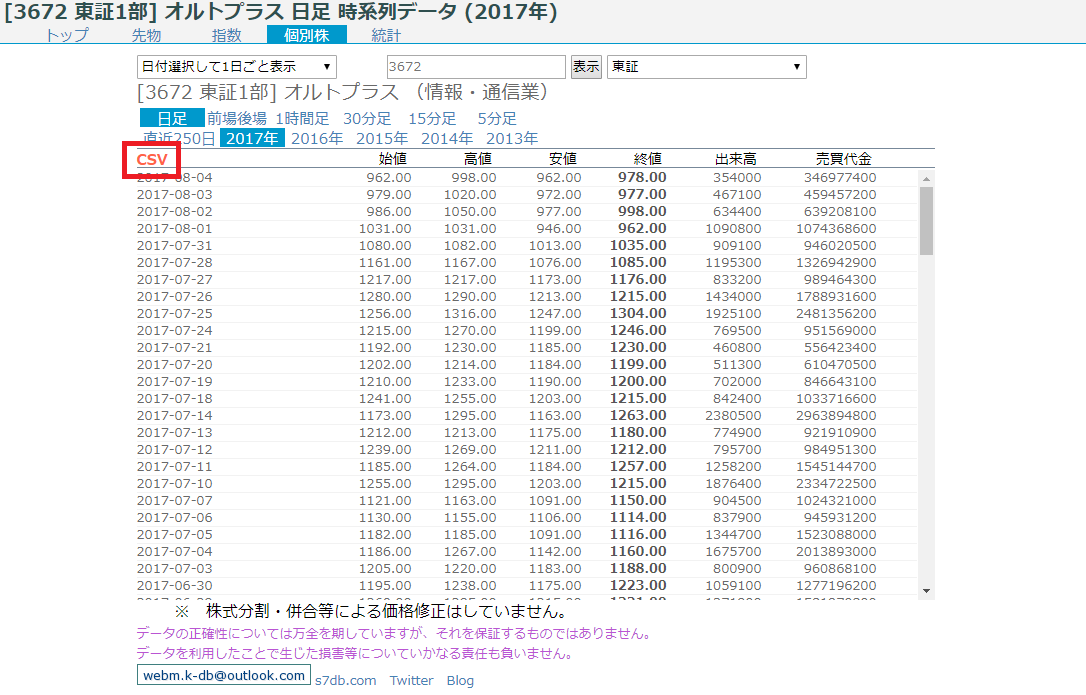
The CSV file is here, so download it to a specific folder. By the way, this data has a new date on the upper side. This time, I downloaded the data of 2015-2017.
Data reading
First, specify the downloaded folder.
Code 1
import os
import pandas as pd
import matplotlib.pyplot as plt

os.chdir("C:\\Users\\Kuma_T\\stock") #Specify the location of the file and put the data first
Next, read the saved CSV file.
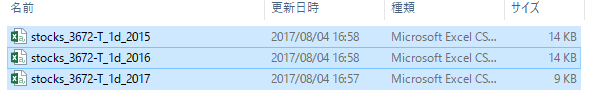
stocks_3672-T_1d_2015 stocks_3672-T_1d_2016 stocks_3672-T_1d_2017 Because we have prepared a file called Brand code 3672 Start loading in 2015 The end of reading is 2017.
Next, make an empty list.
Code 2
code = 3672 #Altplus
start = 2015
end = 2017

x = []
y = []
I will write inside the loop function.
Specify the file name to read and read it with Pandas read_csv (encoding is specified because an error occurs in Japanese). Read the date data in the first column of data as a date with iloc [:, 0] and pd.to_datetime and make it a list. As mentioned above, the CSV file has a new date on the upper side, so add it to the empty list in reverse order with the old date on top.
Similarly, add the closing price in the 4th column to the empty list.
Code 2
for n in range (start, end+1):
    file_name = 'stocks_'+str(code)+'-T_1d_%d.csv' %n #Specify the file name
    data =  pd.read_csv(file_name, header=0, encoding='cp932') #I can't read Japanese, so specify encoding
    a =list(pd.to_datetime(data.iloc[:,0], format='%Y-%m-%d')) #If you read it as it is, the date cannot be recognized, so use datetime
    x += a[::-1] #To reverse the order in the list[::-1]And add to the list of x
    b = list(data.iloc[:,4])
    y += b[::-1]
With this, we were able to obtain the target stock price data in a list type.
Graph and check
When you reach this point, make a graph and check it.
Code 2
plt.plot(x, y, color="blue", linewidth=1, linestyle="-")
plt.show()
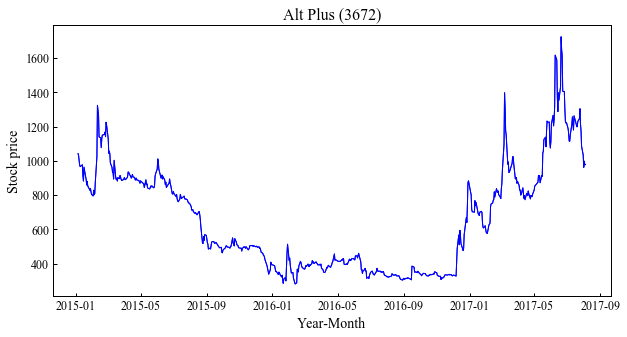
The graph is successfully created.
As a caveat, if you do not read in reverse order, it will be as follows.

Add a moving average
Let's add a moving average as a bonus.
The moving average can be easily calculated by using Pandas' DataFrame.rolling. As the name suggests, DataFrame.rolling is used in DataFrame format, so List is converted.
Code 2
z = pd.DataFrame(y)#Convert to DataFrame
sma75 = pd.DataFrame.rolling(z, window=75,center=False).mean()
sma25 = pd.DataFrame.rolling(z, window=25,center=False).mean()

plt.plot(x, y, color="blue", linewidth=1, linestyle="-")
plt.plot(x, sma25, color="g", linewidth=1, linestyle="-", label="SMA25")
plt.plot(x, sma75, color="r", linewidth=1, linestyle="-", label="SMA75")
This time, we have added a 25-day moving average and a 75-day moving average.
Finally
** I was able to get a list of Japanese stocks ** without scraping. I tried using AltPlus (3672) this time, but please try it with individual brands. Next time, I would like to analyze using this data.
Last but not least, I am still a beginner in stocks and programming. Please comment if you have any.
Introduction of articles etc. referred to below
Let's write stock price forecast code using machine learning in Python http://www.stockdog.work/entry/2017/02/09/211119
[Python / jsm] Obtain stock price data of Japanese companies for each issue https://algorithm.joho.info/programming/python/jsm-get-japan-stock/
Acquire stock price (original series) time series data with Python's jsm module, attach the output line graph to Gmail, and deliver it by email. http://qiita.com/HirofumiYashima/items/471a2126595d705e58b8
Get Japanese stock price information and draw candlestick charts with Python pandas http://sinhrks.hatenablog.com/entry/2015/02/04/002258
Predict stock prices by big data analysis from past data http://qiita.com/ynakayama/items/420ebe206e34f9941e51
1st Scraping stock prices with pandas ~ Try drawing a S ◯ I securities-style chart ~ http://www.stockdog.work/entry/2016/08/26/170152
Although it is not an individual stock, I wrote a new article on stock investment.
"There is a winning method for this game (funded investment) -Shareholding Association Game-" https://qiita.com/Kuma_T/items/667e1b0178a889cc42f7
Recommended Posts