[PYTHON] What is the ROC curve? Why shouldn't it be used for imbalanced data? Easy-to-understand explanation
table of contents#
- What is the ROC curve?
- Understanding terms
- (Again) What is the ROC curve?
- What is ROC-AUC?
- ROC-AUC and imbalance data
Prerequisite knowledge
- Understanding what a mixed matrix is
- What you know about logistic regression.
1. What is ROC curve?
According to Wikipedia "Receiver operating characteristic (ROC) is a concept of signal processing, which is a standard characteristic when determining the existence of something from an observed signal.
The upper part of the figure shows the distribution of the results of a specific test for a certain disease by negative and positive persons. In this example, the negative person shows a value with a smaller overall result. Criterion (criterion, cutoff point) is introduced there, and if it is above that value, it is positive, otherwise it is negative. Now, if you adopt B as the cutoff point ..... "
(゜ ∀ ゜) Fa?
Wikipedia explains it in more detail, so let's read it later, but first let's understand the ROC curve simply.
ROC curve is "a curve created by showing TPR and FPR for each cutoff point of the classifier" </ b>.
To understand this, we first need to know the meaning of the terms (TPR, FPR, cutoff points).
Term understanding
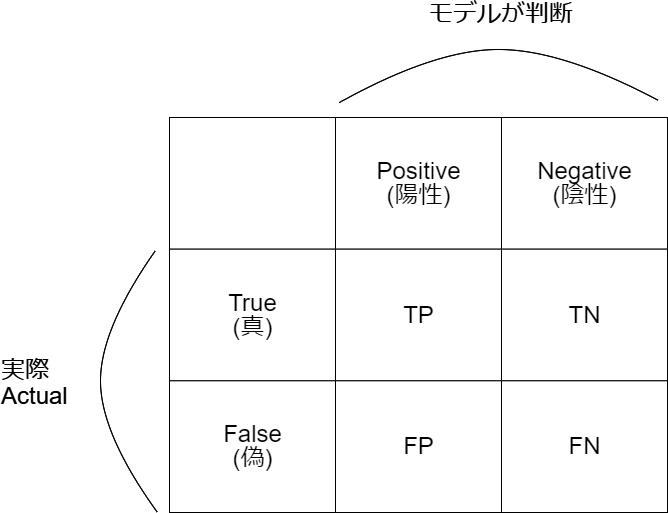
TP (True Positive)
To understand TPR, you first need to understand TP. This is the number of samples that were positive to the classifier and were true </ b>.
FN (False Negative)
This is the number of samples that the classifier was negative (Negative) and it was False (False) </ b>.
FP (False Positive)
This is the number of samples that are positive to the classifier and false. </ B>
TN (True Negative)
This is the number of samples that were Negative to the classifier and were True </ b>.
TPR (True Positive Rate)
This is the percentage of true positives from the total number of positives </ b>.
True Positive (TP)-Number of samples that were judged to be Positive by the classifier and were True
TPR = \frac{TP}{TP+FN} = \frac{TP}{Total number of positives}
FPR (False Positive Rate)
This is the percentage of false positives from the total number of negatives </ b>.
False Positive (FP)-Number of samples that were judged to be Negative by the classifier and were False
FPR = \frac{FP}{FP+TN} = \frac{FP}{Total number of negatives}
Below is a mixed matrix of TP, FP, TN, FN.
Cutoff point
The cutoff point here is the boundary between whether the classifier judges positive or negative </ b>. For example, if there is a patient with a 58% chance of having cancer and the classifier cutoff point is 50%, the patient is 50% or more and is judged positive. If it is 50% or less, it will be judged as negative.
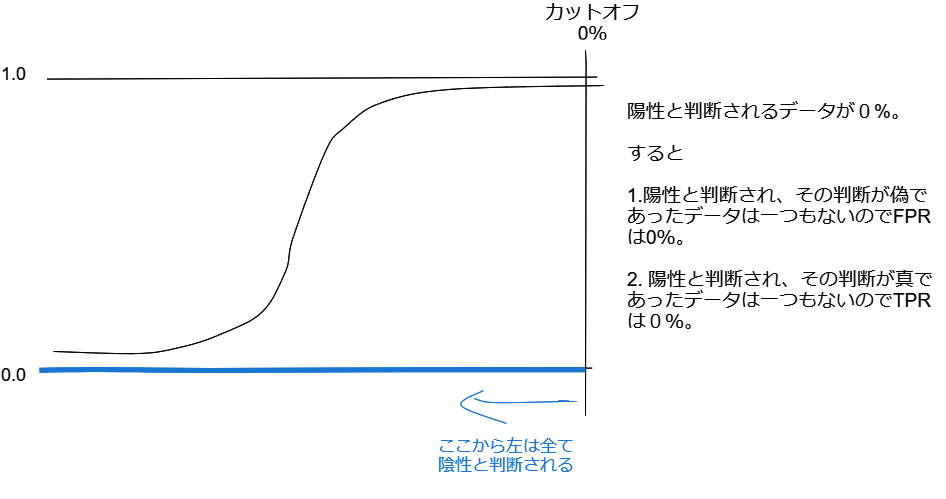
So how can you actually show it with a classifier? The following shows a cutoff of 75% using logistic regression as an example. (By the way, the meaning is the same whether you call the cutoff 25% from the left or 75% from the right, but here we are counting from the right.)
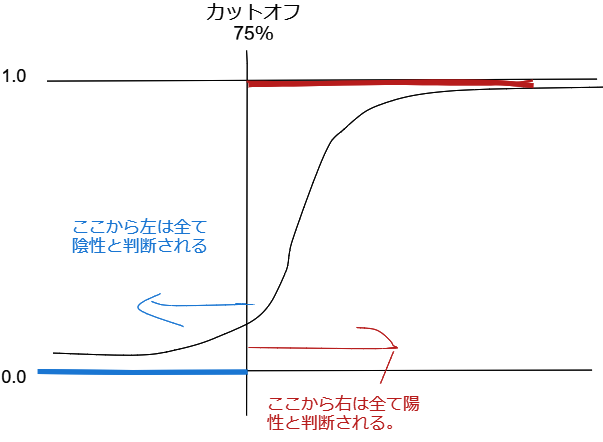
You can see that the classifier determines that all probabilities (Y-axis) above 0.25 are positive.
(Again) What is the ROC curve?
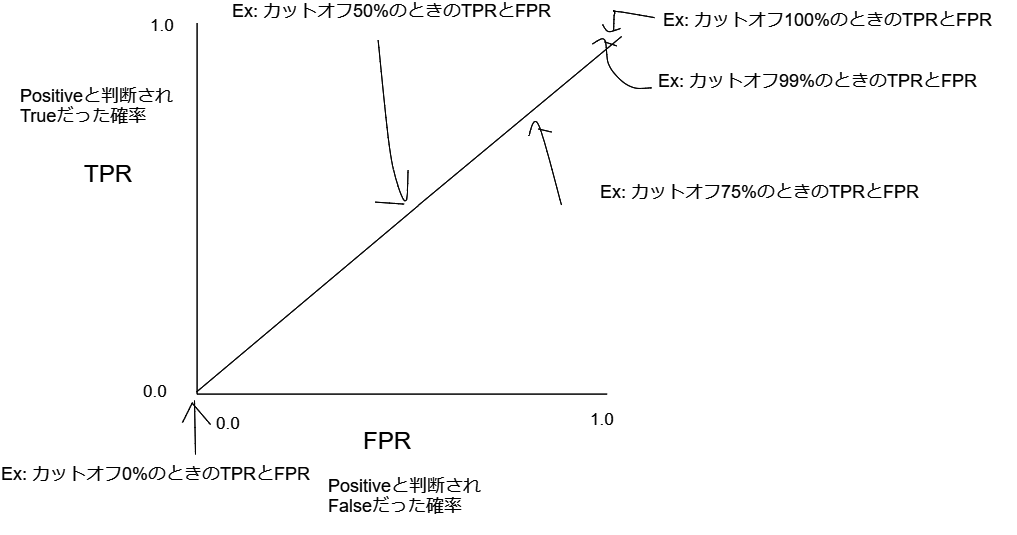
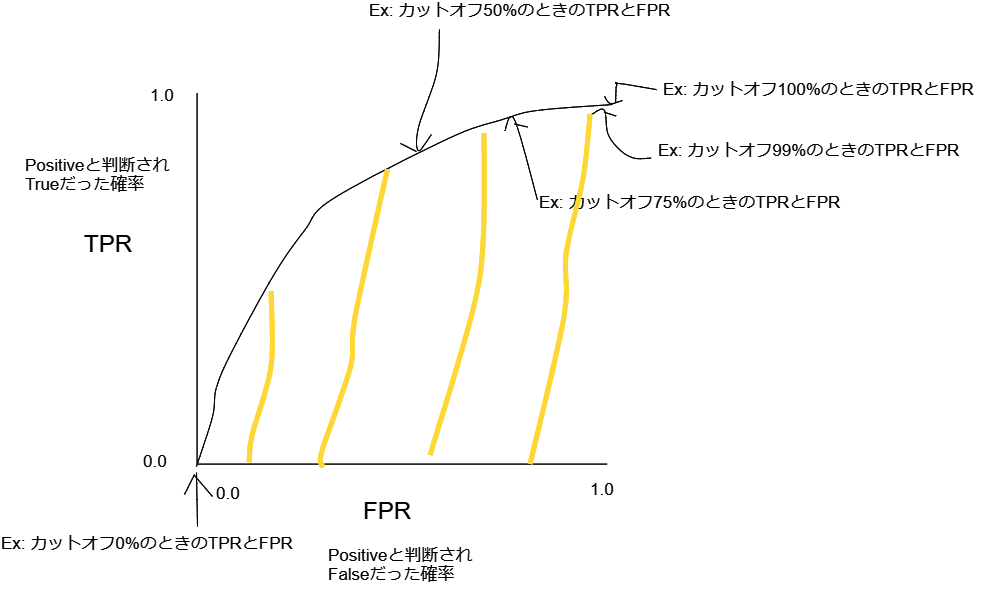
ROC curve is "a curve created by showing TPR and FPR for each cutoff point of the classifier" </ b>.
TPR is shown as the X axis and FPR is shown as the Y axis. The cutoff point ranges from 0% to 100%. </ b>
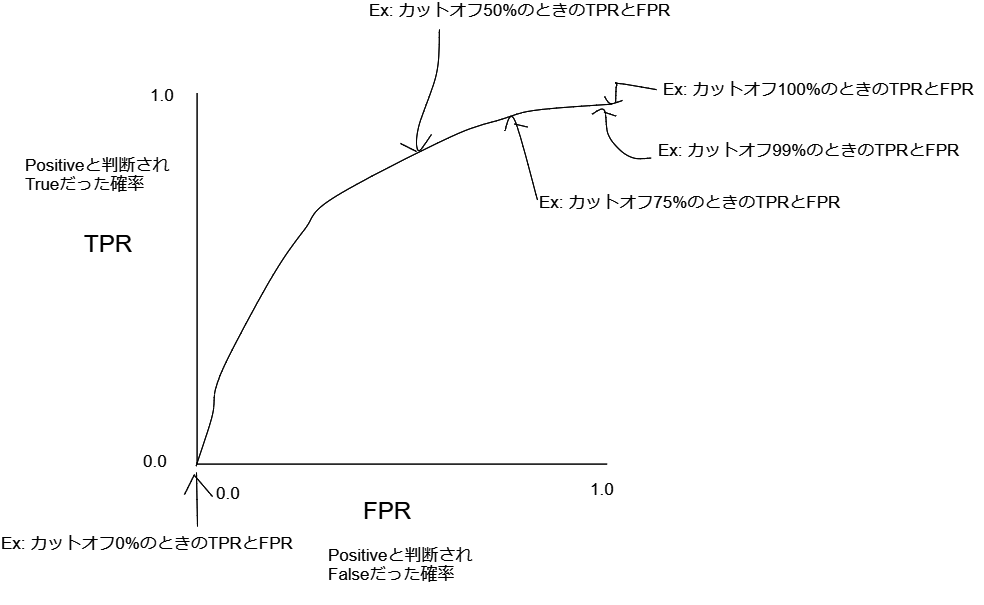
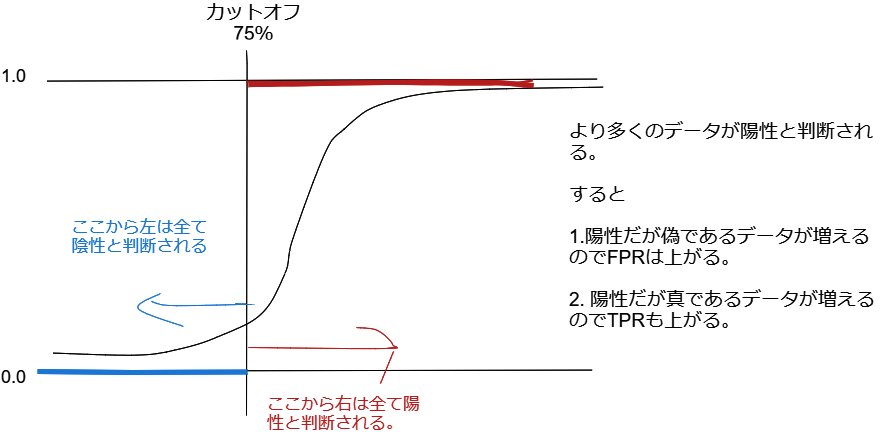
Using a logistic regression classifier as an example, I illustrated why TPR and FPR increase as the cutoff moves toward the negative side.
When the cutoff is 0% (when all data are judged to be negative), the classifier does not judge to be positive in the first place, so it can be seen that both TPR and FPR are zero </ b>.
When the ROC curve is diagonally straight, you can see that the classifier makes a random decision (P (X) = 0.5). This is because TPR and FPR increase at the same rate each time the cutoff moves. </ b>
What is ROC-AUC?
ROC-AUC is the area under the curve.
When ROC-AUC should not be used
When the data is unbalanced
ROC-AUC gives a high score for imbalanced data regardless of the quality of the model. Because FPR tends to be low. </ b> As an extreme example, let's say you have 10000 rows of data (10 rows are positive data and 9990 rows are negative data). Then, the total number of negatives, which is the denominator of FPR, is 9990, and FPR is close to 0 </ b>. On the contrary, TPR does not change that much. Therefore, even when the FPR is low, the TPR is high and the ROC-AUC score is high.
TPR = \frac{TP}{TP+FN} = \frac{TP}{Total number of positives}
FPR = \frac{FP}{FP+TN} = \frac{FP}{Total number of negatives}
Also, ROC-AUC should not be used for imbalanced data as an index to see the difference between the two model scores. </ b>
In the previous example, suppose Model 1 determines 1000 of the 10,000 rows as positive. In that case, the total number of positives is 10 lines, so the FP is 990 lines. So let's say Model 2 determines 100 rows as positive. Then the total number of positives is the same 10 lines, so the FP is 90 lines.
It turns out that model 2 is clearly the best model of model 1 and model 2. However, looking at FPR as an index, model 1 is 90/9990 = 0.0001 and model 2 is 990/9990 = 0.001 (TPR is the same value for both models). It can be seen that there is almost no difference in ROC-AUC scores and the difference in performance between model 1 and model 2 cannot be expressed very much </ b>.
References
Precision-Recall AUC vs ROC AUC for class imbalance problems https://www.kaggle.com/general/7517
The Relationship Between Precision-Recall and ROC Curves http://pages.cs.wisc.edu/~jdavis/davisgoadrichcamera2.pdf
Recommended Posts