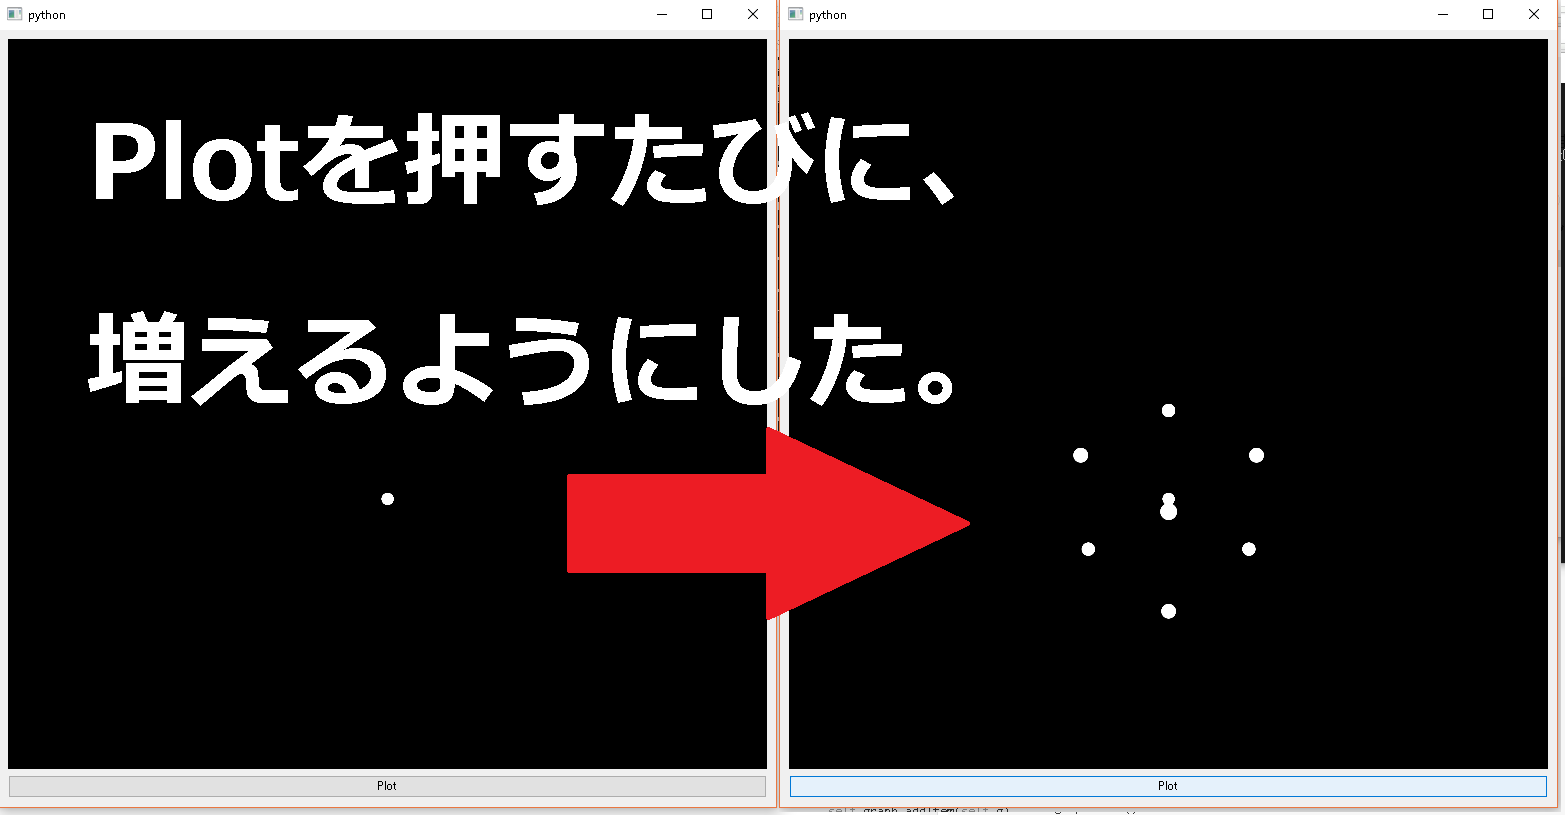
[PYTHON] 3D scatter plot with PyQtGraph
I tried to challenge the GUI of 3D plot using PyQtGraph. For those who have never done it, I thought it was a tough job, so I wrote it down. I did it on Windows.
I'll write the code first, but ** if you can't do it, read below. ** Maybe it just doesn't include OpenGL (pyopengl).
For the time being
Save the following code as a file such as home a.py and execute it with python a.py. I intend to try it with as simple a structure as possible.
import sys
from PySide import QtCore, QtGui
import numpy as np
import pyqtgraph.opengl as gl
import pyqtgraph as pg


class Ui_MainWindow(object):
    def setupUi(self, MainWindow):
        MainWindow.setObjectName("MainWindow")
        MainWindow.resize(777, 777)
        self.centralwidget = QtGui.QWidget(MainWindow)
        self.centralwidget.setObjectName("centralwidget")
        MainWindow.setCentralWidget(self.centralwidget)

        self.verticalLayout = QtGui.QVBoxLayout(self.centralwidget)
        self.verticalLayout.setObjectName("verticalLayout")

        self.graph = gl.GLViewWidget(self.centralwidget)
        self.graph.setObjectName("graph")
        self.verticalLayout.addWidget(self.graph)

        self.graph.opts['distance'] = 30
        self.graph.show()
        self.g = gl.GLGridItem()
        self.graph.addItem(self.g)

        self.n=1
        numX, startX, endX = self.n, -1, 1+self.n
        numY, startY, endY = self.n, -1, 1+self.n
        numZ, startZ, endZ = self.n, -1, 1+self.n

        X = np.linspace(startX, endX, numX)
        Y = np.linspace(startY, endY, numY)
        Z = np.linspace(startZ, endZ, numZ)

        #position of scatter in 3D
        pos = np.array([[i,j,k] for i in X for j in Y for k in Z])

        color = (1,1,1,1)
        size = 0.5

        self.scttrPlt = gl.GLScatterPlotItem(pos=pos, size=size, color=color, pxMode=False)
        self.scttrPlt.translate(5,5,0)
        self.graph.addItem(self.scttrPlt)

        self.psbtn = QtGui.QPushButton(self.centralwidget)
        self.psbtn.setObjectName("psbtn")
        self.psbtn.setText("Plot")
        self.verticalLayout.addWidget(self.psbtn)

        QtCore.QObject.connect(self.psbtn, QtCore.SIGNAL("clicked()"), self.plot)

    def plot(self):
        self.n+=1
        numX, startX, endX = self.n, -1, 1+self.n
        numY, startY, endY = self.n, -1, 1+self.n
        numZ, startZ, endZ = self.n, -1, 1+self.n

        X = np.linspace(startX, endX, numX)
        Y = np.linspace(startY, endY, numY)
        Z = np.linspace(startZ, endZ, numZ)

        pos = np.array([[i,j,k] for i in X for j in Y for k in Z])
        color = (1,1,1,1)
        size = 0.5

        self.scttrPlt.setData(pos=pos,color=color,size=size)


pg.setConfigOption('foreground', 'k')
pg.setConfigOption('background', 'w')


class ControlMainWindow(QtGui.QMainWindow):
    def __init__(self, parent=None):
        super(ControlMainWindow, self).__init__(parent)
        self.ui = Ui_MainWindow()
        self.ui.setupUi(self)

if __name__ == "__main__":
    app = QtGui.QApplication(sys.argv)
    mySW = ControlMainWindow()
    mySW.show()
    sys.exit(app.exec_())
What you need OpenGL
- OpenGL
- PyQtGraph
- Python
- PySide
At the time of writing this, I don't know what OpenGL is. When using 3DCG software, it is recognized that a check box such as OpenGL appears.
python -m pyqtgraph.example
Even if you select "3D graphics> Scatter plot" from the launcher of I only got an error. I get the following error.
E:\hoge>python -m pyqtgraph.examples
Using PySide (default graphics system)
Using PySide (default graphics system)
Traceback (most recent call last):
  File "C:\Python27\lib\site-packages\pyqtgraph\examples\GLScatterPlotItem.py", line 11, in <module>
    import pyqtgraph.opengl as gl
  File "C:\Python27\lib\site-packages\pyqtgraph\opengl\__init__.py", line 1, in <module>
    from .GLViewWidget import GLViewWidget
  File "C:\Python27\lib\site-packages\pyqtgraph\opengl\GLViewWidget.py", line 2, in <module>
    from OpenGL.GL import *
ImportError: No module named OpenGL.GL
There is no module named OpenGL.GL ... Let's do the following on the command line. By the way, the name is not OpenGL, but pyopengl in all lowercase.
pip install pyopengl
E:\hogehoge>pip install pyopengl
Collecting pyopengl
  Downloading PyOpenGL-3.1.0.tar.gz (1.2MB)
    100% |################################| 1.2MB 298kB/s
Building wheels for collected packages: pyopengl
  Running setup.py bdist_wheel for pyopengl ... done
  Stored in directory: C:\Users\yusuke\AppData\Local\pip\Cache\wheels\1c\17\50\f69d63e0a8169fb890f5a167817a73391be85d30e86fd29504
Successfully built pyopengl
Installing collected packages: pyopengl
Successfully installed pyopengl-3.1.0
This time, it's done.
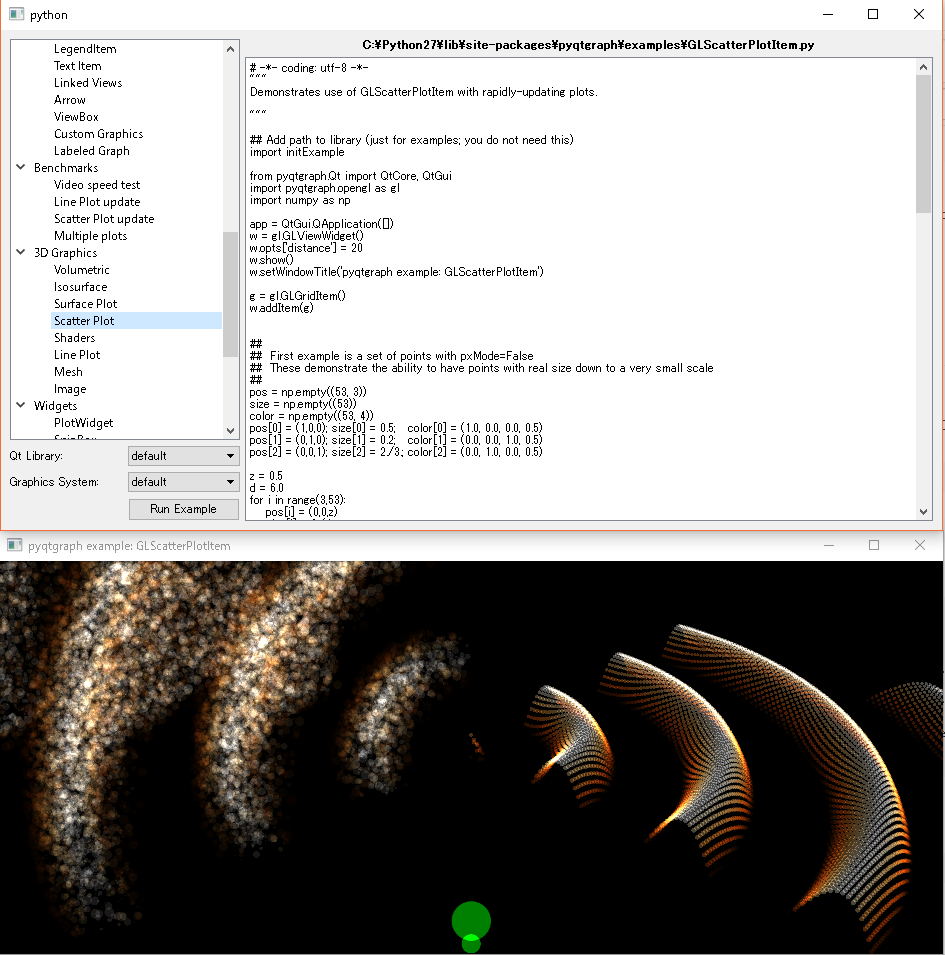 The image above is a sample that comes with PyQt Graph. It works in real time.
You can also check the code from the sample launcher.
The image above is a sample that comes with PyQt Graph. It works in real time.
You can also check the code from the sample launcher.
pip must be the latest version
python -m pip install --upgrade pip
let's do it. I didn't do it, so I got the following error.
E:\hoge>pip install pyopengl
Collecting OpenGL
  Could not find a version that satisfies the requirement OpenGL (from versions: )
No matching distribution found for OpenGL
You are using pip version 8.1.2, however version 9.0.1 is available.
You should consider upgrading via the 'python -m pip install --upgrade pip' command.
Recommended Posts