Java creates a pie chart in Excel
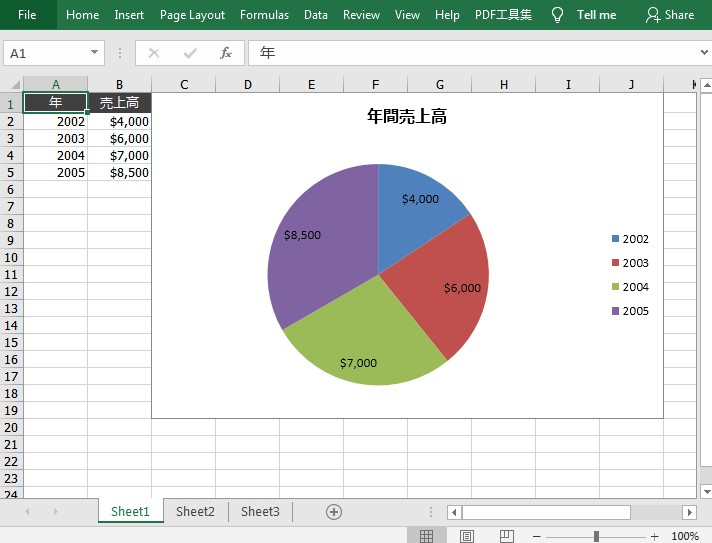
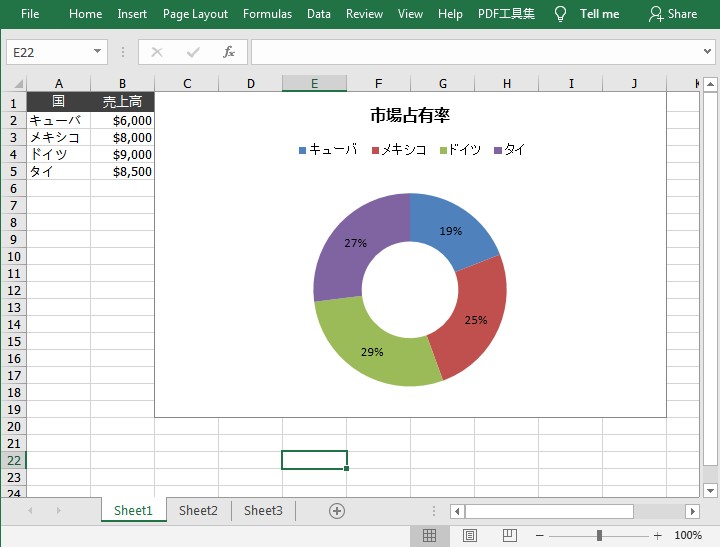
Pie charts are a popular graphing tool in Excel. Pie charts allow you to directly graph the overall proportions of each component, helping you to analyze and understand abstract data more quickly and intuitively. A ring chart is a variant of a pie chart. Visually, the ring chart removes the central part, but its main function is to interpret the ratio relationship between the data. This article will show you how to use Free Spire.XLS for Java to create pie charts and ring charts in an Excel document through your code.
** Environment configuration: ** ** 1. ** Free Spire.XLS for Java Download the package, unzip it, and in the lib folder Import the Spire.Xls.jar package into your Java application as a dependency.
** 2. ** You can also install the JAR package directly from the Maven repository The code that makes up the pom.xml file is:
<repositories>
        <repository>
            <id>com.e-iceblue</id>
            <name>e-iceblue</name>
            <url>http://repo.e-iceblue.com/nexus/content/groups/public/</url>
        </repository>
</repositories>
<dependencies>
    <dependency>
        <groupId>e-iceblue</groupId>
        <artifactId>spire.xls.free</artifactId>
        <version>2.2.0</version>
    </dependency>
</dependencies>
pie chart:
import com.spire.xls.*;
import com.spire.xls.charts.ChartSerie;

import java.awt.*;

public class CreatePieChart {

    public static void main(String[] args) {

        //Create a workbook object
        Workbook workbook = new Workbook();

        //Get the first worksheet
        Worksheet sheet = workbook.getWorksheets().get(0);

        //Write data to worksheet
        sheet.getCellRange("A1").setValue("Year");
        sheet.getCellRange("A2").setValue("2002");
        sheet.getCellRange("A3").setValue("2003");
        sheet.getCellRange("A4").setValue("2004");
        sheet.getCellRange("A5").setValue("2005");

        sheet.getCellRange("B1").setValue("amount of sales");
        sheet.getCellRange("B2").setNumberValue(4000);
        sheet.getCellRange("B3").setNumberValue(6000);
        sheet.getCellRange("B4").setNumberValue(7000);
        sheet.getCellRange("B5").setNumberValue(8500);

        //Set cell style
        sheet.getCellRange("A1:B1").setRowHeight(15);
        sheet.getCellRange("A1:B1").getCellStyle().setColor(Color.darkGray);
        sheet.getCellRange("A1:B1").getCellStyle().getExcelFont().setColor(Color.white);
        sheet.getCellRange("A1:B1").getCellStyle().setVerticalAlignment(VerticalAlignType.Center);
        sheet.getCellRange("A1:B1").getCellStyle().setHorizontalAlignment(HorizontalAlignType.Center);
        sheet.getCellRange("B2:C5").getCellStyle().setNumberFormat("\"$\"#,##0");

        //Add pie chart
        Chart chart = sheet.getCharts().add(ExcelChartType.Pie);

        //Set the graph data area
        chart.setDataRange(sheet.getCellRange("B2:B5"));
        chart.setSeriesDataFromRange(false);

        //Set the position of the chart
        chart.setLeftColumn(3);
        chart.setTopRow(1);
        chart.setRightColumn(11);
        chart.setBottomRow(20);

        //Set the title of the graph
        chart.setChartTitle("Annual sales");
        chart.getChartTitleArea().isBold(true);
        chart.getChartTitleArea().setSize(12);

        //Series label settings
        ChartSerie cs = chart.getSeries().get(0);
        cs.setCategoryLabels(sheet.getCellRange("A2:A5"));
        cs.setValues(sheet.getCellRange("B2:B5"));
        cs.getDataPoints().getDefaultDataPoint().getDataLabels().hasValue(true);
        chart.getPlotArea().getFill().setVisible(false);

        //Save the document
        workbook.saveToFile("piechart.xlsx", ExcelVersion.Version2016);
    }
}

** Donut Graph: **
import com.spire.xls.*;
import com.spire.xls.charts.ChartSerie;
import com.spire.xls.charts.ChartSeries;

import java.awt.*;

public class CreateDoughnutChart {

    public static void main(String[] args) {

        //Create a workbook object
        Workbook workbook = new Workbook();

        //Get the first worksheet
        Worksheet sheet = workbook.getWorksheets().get(0);

        //Write data to worksheet
        sheet.getCellRange("A1").setValue("Country");
        sheet.getCellRange("A2").setValue("Cuba");
        sheet.getCellRange("A3").setValue("Mexico");
        sheet.getCellRange("A4").setValue("Germany");
        sheet.getCellRange("A5").setValue("Thailand");

        sheet.getCellRange("B1").setValue("amount of sales");
        sheet.getCellRange("B2").setNumberValue(6000);
        sheet.getCellRange("B3").setNumberValue(8000);
        sheet.getCellRange("B4").setNumberValue(9000);
        sheet.getCellRange("B5").setNumberValue(8500);

        //Set cell style
        sheet.getCellRange("A1:B1").setRowHeight(15);
        sheet.getCellRange("A1:B1").getCellStyle().setColor(Color.darkGray);
        sheet.getCellRange("A1:B1").getCellStyle().getExcelFont().setColor(Color.white);
        sheet.getCellRange("A1:B1").getCellStyle().setVerticalAlignment(VerticalAlignType.Center);
        sheet.getCellRange("A1:B1").getCellStyle().setHorizontalAlignment(HorizontalAlignType.Center);
        sheet.getCellRange("B2:C5").getCellStyle().setNumberFormat("\"$\"#,##0");

        //Add pie chart
        Chart chart = sheet.getCharts().add(ExcelChartType.Doughnut);

        //Set the graph data area
        chart.setDataRange(sheet.getCellRange("A1:B5"));
        chart.setSeriesDataFromRange(false);

        //Set the position of the chart
        chart.setLeftColumn(3);
        chart.setTopRow(1);
        chart.setRightColumn(11);
        chart.setBottomRow(20);

        //Set the title of the chart
        chart.setChartTitle("market share");
        chart.getChartTitleArea().isBold(true);
        chart.getChartTitleArea().setSize(12);

        //Set the color of the series
        ChartSeries series = chart.getSeries();
        for (int i = 0 ; i < series.size() ; i++) {
            ChartSerie cs = series.get(i);
            cs.getDataPoints().getDefaultDataPoint().getDataLabels().hasPercentage(true);
        }

        //Set the position of the legend
        chart.getLegend().setPosition(LegendPositionType.Top);

        //Save the document
        workbook.saveToFile("doughnutchart.xlsx", ExcelVersion.Version2016);
    }
}

Recommended Posts