[PYTHON] [Statistics] Visualize and understand the Hamiltonian Monte Carlo method with animation.
This article is about trying to understand the operating principle of the Hamiltonian Monte Carlo method (HMC) using animation. This is a sequel to the other day's article, "[Statistics] Markov Chain Monte Carlo (MCMC) sampling is explained with animation."](Http://qiita.com/kenmatsu4/items/55e78cc7a5ae2756f9da).
I used the example of Professor Toyoda's book "Bayesian Statistics from the Basics". The distribution to be sampled will be the gamma distribution this time. This article only gives a theoretical explanation of the parts used for animation, so please refer to this book for a detailed explanation of HMC.
Introduction
The target to be estimated is the gamma distribution with $ \ theta $ as a variable. Since the parameters to be estimated by Bayesian estimation are represented by $ \ theta $, they are represented as a distribution of $ \ theta $. [^ 1]
[^ 1]: The gamma distribution is a relatively simple distribution that can provide sufficient information as it is, but here we will assume that this was a difficult posterior distribution. Random numbers are generated from this posterior distribution using HMC, and information on the posterior distribution is searched for from the obtained random number sequence.
Here is the gamma distribution.
Focusing only on the kernel part of this gamma distribution excluding the normalization constants,
At HMC, this is logged and multiplied by a minus, that is

Hamiltonian derived from the relationship between potential energy $ h (\ theta) $ and kinetic energy $ p $
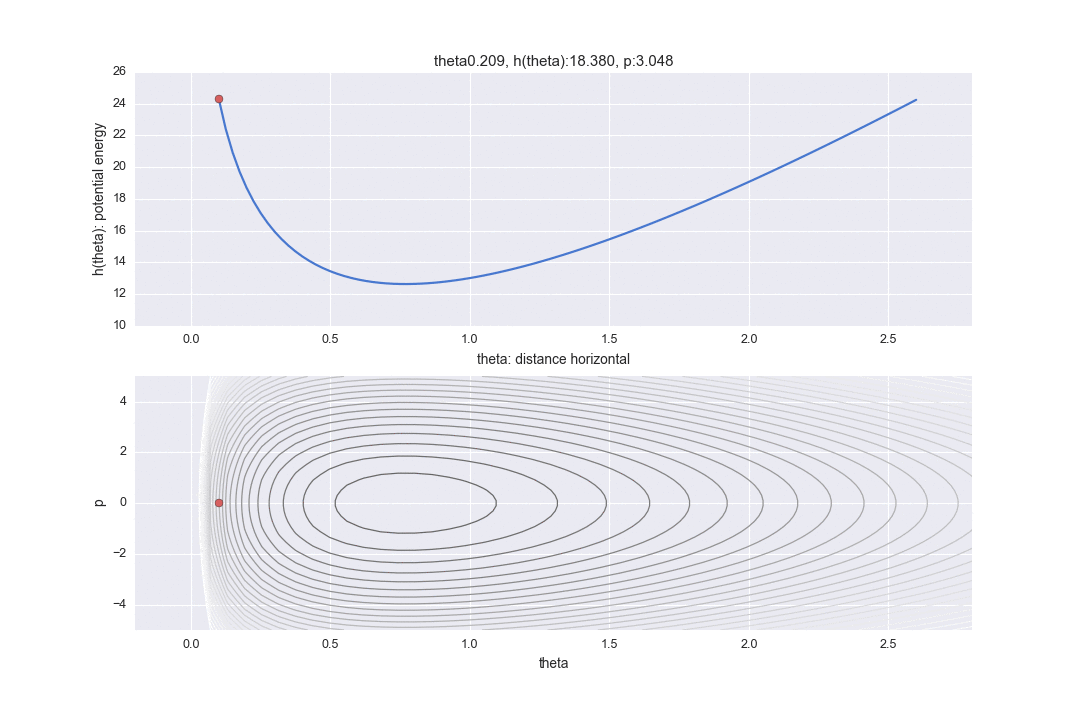
In addition, the graph in the lower part is a graph of what is called a phase space, with the horizontal axis representing the horizontal distance $ \ theta $ and the vertical axis representing the kinetic energy $ p $. (Unlike textbooks, the graph is inverted vertically and horizontally to align the horizontal axis with the graph above.) The contour lines represent the part where the Hamiltonian is constant. Therefore, on the premise that the Hamiltonian is constant, it is shown in two display methods, the corresponding horizontal position and the kinetic energy are different.
Leapfrog method
As shown in the figure above, the Leapfrog method is used as a method of numerically calculating the Hamiltonian so that it moves in a certain place. For details of the theory, refer to the book, but here I will post the python code. It is a method to reduce the error due to numerical calculation by calculating the position next to $ p $ in half.
# function definitions

def h(theta):
    global lam, alpha
    return lam * theta - (alpha-1)*np.log(theta)

def dh_dtheta(theta):
    global lam, alpha
    return lam - (alpha - 1)/theta

def hamiltonian(p, theta):
    return h(theta) + 0.5*p**2

vhamiltonian = np.vectorize(hamiltonian)  # vectorize

def leapfrog_nexthalf_p(p, theta, eps=0.01):
    """
    1/Calculate p after 2 steps
    """
    return p - 0.5 * eps* dh_dtheta(theta)

def leapfrog_next_theta(p, theta, eps=0.01):
    """
Calculate θ after one step
    """
    return theta + eps*p


def move_one_step(theta, p, eps=0.01, L=100, stlide=1):
    """
Execute one step that moved L times by the leapfrog method
    """
    ret = []
    ret.append([1, p, theta, hamiltonian(p,theta)])
    for _ in range(L):
        p = leapfrog_nexthalf_p(p, theta, eps)
        theta = leapfrog_next_theta(p, theta, eps)
        p = leapfrog_nexthalf_p(p, theta, eps)
        ret.append([1, p, theta, hamiltonian(p,theta)])
    return ret[::stlide]
#Execution of leapfrog method
# initial param
theta = 0.1
p = 0
eps = 0.05
L = 96

result = move_one_step(theta, p, eps=eps, L=100, stlide=1)
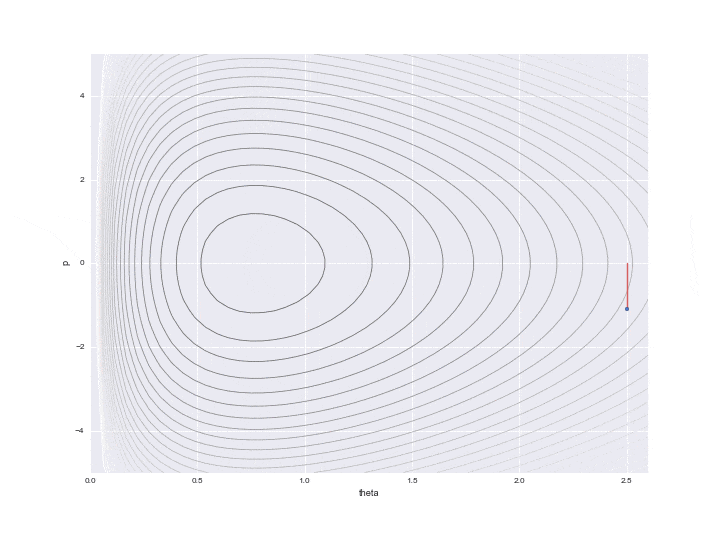
Transition by Leapfrog method and change of momentum p by standard normal distribution
The one transition specified by $ L $ is shown by the dotted line in the graph below. It was difficult to write all the L trajectories, so I skipped 12 of them. So, in reality, the points are moving more finely.
In addition, a red line is displayed in the middle, which means that the potential energy was changed randomly once after the transition L times. In particular
p = rd.normal(loc=0,scale=scale_p) # ------(*)
$ P $ is updated with a random number that follows a standard normal distribution as represented by the code. (I don't understand why ** "standard" ** normal distribution is used here. It doesn't seem bad to be able to adjust the variance as a parameter ... If anyone knows, please let me know ... At this point, the Hamiltonian's conservation is broken, and the contour lines of different Hamiltonian values are moved L times again. Only one point just before this red line is drawn is actually used for sampling, and the remaining values are simply discarded as values in the middle of calculation.
rd.seed(123)
theta = 2.5
eps = 0.01
T = 15

step = []
prev_p = 0

for tau in range(T):
    p = rd.normal(loc=0,scale=scale_p)       # ------(*)
    step.append([2, p, prev_p, 0])
    one_step = move_one_step(theta, p, eps=eps, L=96, stlide=12)
    theta = one_step[-1][2]
    step.extend(one_step)
    prev_p = one_step[-1][1]


print len(step)

def animate(nframe):
    global num_frame, n
    sys.stdout.write("{}, ".format(nframe))

    if step[n][0] == 1:
        plt.scatter(step[n][2], step[n][1], s=20, zorder=100)
        if step[n-1][0] == 1:
            plt.plot([step[n-1][2], step[n][2]],[step[n-1][1], step[n][1]], c="k", ls="--", lw=.8, alpha=0.5)

    else:
        theta = step[n+1][2]

        plt.plot([theta, theta], [step[n][2], step[n][1]], c="r")

    n += 1


num_frame = len(step)-1
n = 0
scale_p = 1
fig = plt.figure(figsize=(12,9))

xx = np.linspace(0.01, 2.6)
yy = np.linspace(-5,5)
X, Y = np.meshgrid(xx, yy)
Z = vhamiltonian(Y, X)
plt.contour(X, Y, Z, linewidths=1, cm=cm.rainbow, levels=np.linspace(0,40,40))

plt.ylabel("p")
plt.xlabel("theta")
plt.xlim(0,2.6)
plt.ylim(-5,5)

anim = ani.FuncAnimation(fig, animate, frames=int(num_frame), blit=True)
anim.save('hmc_sampling_detail.gif', writer='imagemagick', fps=5, dpi=60)
sampling
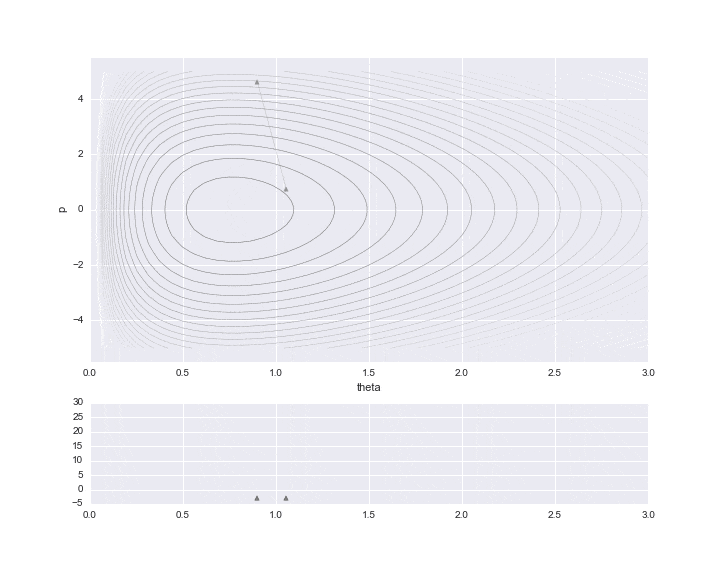
Below is the result of plotting only the data that is actually needed.
Also,
To be the acceptance rate as $ \ min (1, r) $
r = np.exp(prev_hamiltonian-H) # -----(**)
And rd.uniform () are compared to determine acceptance or non-acceptance. However, in the case of this example, it was never rejected, so it is all accepted.
The burn-in period is set to 10, and the sampled values are indicated by ▲ during that period.
The lower graph is a histogram of the $ \ theta $ values to be estimated. We have only sampled a little less than 200, but we can see that it is a histogram of the distribution shape like a gamma distribution distorted to the right.
# HMC simulation
rd.seed(71)
scale_p = 1

# initial param
theta = 2.5
p = rd.normal(loc=0,scale=scale_p)
eps = 0.01
L = 100
T = 10000
sim_result = []
prev_hamiltonian = hamiltonian(p,theta)
sim_result.append([ p, theta, prev_hamiltonian, True])
for t in range(T):
    prev_p = p
    prev_theta = theta
    prev_hamiltonian = hamiltonian(p,theta)
    for i in range(L):
        p = leapfrog_nexthalf_p(p, theta, eps=eps)
        theta = leapfrog_next_theta(p, theta, eps=eps)
        p = leapfrog_nexthalf_p(p, theta, eps=eps)

    H = hamiltonian(p,theta)
    r = np.exp(prev_hamiltonian-H)       # -----(**)
    if  r > 1:
        sim_result.append([ p, theta, hamiltonian(p,theta), True])
    elif r > 0 and rd.uniform() < r:
        sim_result.append([ p, theta, hamiltonian(p,theta), True])
    else:
        sim_result.append([ p, theta, hamiltonian(p,theta), False])
        theta = prev_theta

    p = rd.normal(loc=0,scale=scale_p)

sim_result = np.array(sim_result)
df = pd.DataFrame(sim_result, columns="p,theta,hamiltonian,accept".split(","))
#df
print "accept ratio: ", np.sum([df.accept == 1])/len(df)
Acceptance is close to 100%: smile:
out
accept ratio: 0.999900009999
Here is the code that generated the animation up to T = 200.
def animate(nframe):
    global num_frame, n
    sys.stdout.write("{}, ".format(nframe))

    ####Upper row#####
    if n < burn_in:
        marker = "^"
        color  = "gray"
        lc     = "gray"
    else:
        marker = "o"
        color  = "b"
        lc     = "green"

    if sim_result[i,3]  == 0:
        marker = "x"
        color  = "r"
        lc     = "gray"

    axs[0].scatter(sim_result[n,1], sim_result[n,0], s=20, marker=marker,
                   zorder=100, alpha=0.8, color=color) #,

    if n > 1:
        axs[0].plot([sim_result[n-1,1], sim_result[n,1]],
                    [sim_result[n-1,0], sim_result[n,0]], c=lc, lw=0.5, alpha=0.4)


    ####Lower row#####
    axs[1].scatter(sim_result[n,1], -3, alpha=1, marker=marker, c=color)

    if n > burn_in:
        hist_data = pd.DataFrame(sim_result[burn_in:n], columns="p,theta,hamiltonian,accept".split(","))
        hist_data = hist_data[hist_data.accept ==1]
        hist_data.theta.hist(bins=np.linspace(0,3,31),ax=axs[1], color="blue",)
    ### ========================

    n += 1

burn_in = 10
num_frame = 200
n = 1
n_col = 1
n_row = 2

fig, _ = plt.subplots(n_row, n_col, sharex=False, figsize=(10,8))
gs = gridspec.GridSpec(n_row, n_col, height_ratios=[3,1])
axs = [plt.subplot(gs[i]) for i in range(n_row*n_col)]

xx = np.linspace(0.01, 3)
yy = np.linspace(-5,5)
X, Y = np.meshgrid(xx, yy)
Z = vhamiltonian(Y, X)
axs[0].contour(X, Y, Z, linewidths=0.5, cm=cm.rainbow, levels=np.linspace(0,40,40))

axs[0].set_ylabel("p")
axs[0].set_xlabel("theta")
axs[0].set_xlim(0,3)
axs[1].set_xlim(0,3)
axs[1].set_ylim(-5,30)

anim = ani.FuncAnimation(fig, animate, frames=int(num_frame), blit=True)
anim.save('hmc_simulation2.gif', writer='imagemagick', fps=4, dpi=72)
Full-scale sampling
Up to the above, T was set to a small value of 200 for animation, but here is a plot of all T = 10000. burn-in is specified as 1000.

A trace plot of $ \ theta $. The gray part in the first half is the burn-in part.

Here is a histogram of the results. If you compare it with the gamma distribution of $ \ alpha = 11, \ lambda = 13 $, you can see that they are almost the same: grin:

in conclusion
It was said that using the Hamiltonian Monte Carlo method would increase the acceptance rate of sampling, but it was found that the acceptance rate was certainly high (nearly 100% this time): satisfied:
reference
"Bayes Statistics from the Basics-Practical Introduction to the Hamiltonian Monte Carlo Method-" (edited by Hideki Toyoda) https://www.asakura.co.jp/books/isbn/978-4-254-12212-1/
Full code for this article https://github.com/matsuken92/Qiita_Contents/blob/master/Bayes_chap_05/HMC_Gamma-for_Publish.ipynb (Recommended browsing on PC, please browse in desktop mode on smartphone.)
Preferences to generate animated GIFs from Python on Mac http://qiita.com/kenmatsu4/items/573ca0733b192d919d0e
Introduction to Bayesian Statistics from the Basics http://stats-study.connpass.com/event/27129/ → This is a study session for this book that I am hosting.
Recommended Posts