Python debugging tips
Python debugging tips
This article is the 24th day article of Python Advent Calendar 2016. Here are some tips for debugging Python.
Debug with print ()
Debug by printing the value you want to check to stdout using the print () function. If this solves it, it's better than that.
Debug FizzBuzz. This time I want to output FizzBuzz using a number from 1 to 20. The code below has an obvious bug. Do you understand?
example_fizzbuzz_buggy.py::
for ii in range(1, 21):
    if ii % 3 == 0:
        print('Fizz')
    elif ii % 5 == 0:
        print('Buzz')
    elif ii % 15 == 0:
        print('FizzBuzz')
    else:
        print(ii)
When you do this, example_fizzbuzz.py will display the following message:
$ python example_fizzbuzz.py
1
2
Fizz
4
Buzz
Fizz
7
8
Fizz
Buzz
11
Fizz
13
14
Fizz
16
17
Fizz
19
Buzz
Something is wrong. There is no indication of FizzBuzz. If it is 15, you should see FizzBuzz. Let's add print () to see the behavior at 15.
for ii in range(1, 21):
    print('CURRENT: {}'.format(ii))  #add to
    if ii % 3 == 0:
        print('Fizz')
    elif ii % 5 == 0:
        print('Buzz')
    elif ii % 15 == 0:
        print('HIT')  #add to
        print('FizzBuzz')
    else:
        print(ii)
The line commented add is the added print (). I added the code to output the following debug message.
--Display the current number as CUURENT: 1
--Display HIT when the number is divisible by 15.
Let's do it.
$ python  example_fizzbuzz.py
CURRENT: 1
1
CURRENT: 2
2
CURRENT: 3
Fizz
CURRENT: 4
4
CURRENT: 5
Buzz
CURRENT: 6
Fizz
CURRENT: 7
7
CURRENT: 8
8
CURRENT: 9
Fizz
CURRENT: 10
Buzz
CURRENT: 11
11
CURRENT: 12
Fizz
CURRENT: 13
13
CURRENT: 14
14
CURRENT: 15
Fizz
CURRENT: 16
16
CURRENT: 17
17
CURRENT: 18
Fizz
CURRENT: 19
19
CURRENT: 20
Buzz
When CURRENT: 15 is displayed, Fizz is displayed, and HIT is not displayed. This means that we are executing the block of ʻif ii% 3 == 0:and not the block of ʻelif ii% 15 == 0:. If ii is 15, it is naturally divisible by 3, so ʻif ii% 3 == 0:is True, and ʻelif ii% 15 == 0:after it is not executed because of ʻelif. .. I found that ʻii% 15 == 0 had to branch before other conditions, so I'll fix the code.
$ python example_fizzbuzz.py
CURRENT: 1
1
CURRENT: 2
2
CURRENT: 3
Fizz
CURRENT: 4
4
CURRENT: 5
Buzz
CURRENT: 6
Fizz
CURRENT: 7
7
CURRENT: 8
8
CURRENT: 9
Fizz
CURRENT: 10
Buzz
CURRENT: 11
11
CURRENT: 12
Fizz
CURRENT: 13
13
CURRENT: 14
14
CURRENT: 15
HIT
FizzBuzz
CURRENT: 16
16
CURRENT: 17
17
CURRENT: 18
Fizz
CURRENT: 19
19
CURRENT: 20
Buzz
If it is 15, we are displaying HIT and FizzBuzz. Sounds good. The bug has been removed. After that, delete the print () added earlier. The final code looks like this:
example_fizzbuzz.py::
for ii in range(1, 21):
    if ii % 15 == 0:
        print('FizzBuzz')
    elif ii % 3 == 0:
        print('Fizz')
    elif ii % 5 == 0:
        print('Buzz')
    else:
        print(ii)
This technique is commonly used in any programming language. And it's easy to forget to delete the last print (). Don't forget to delete it.
Check the program behavior line by line using pdb
In debugging using print (), I checked how the program works by printing a debug message to stdout. A simple program can keep up with the process, but as it gets more complicated, it becomes difficult to understand the movement from the debug message alone. If you use pdb, you can execute the program while checking it line by line, and you can check the value of the variable at that time, so you can check the value of the program more. It will be easier to follow the process.
Now, run the buggy ʻexample_fizzbuzz_buggy.py` using pdb. Since pdb is a standard library, you don't need to install it with pip.
$ python -m pdb example_fizzbuzz_buggy.py
> /working/advent-calendar-2016-python/example_fizzbuzz_buggy.py(1)<module>()
-> for ii in range(1, 21):
(Pdb)
Add -m pdb to the Python arguments. The script executed by pdb stops at the first code to be executed and waits for input. Operate the debugger by specifying the pdb command here and entering ENTER. Details of the pdb command are explained in 27.3. pdb — Python Debugger — Python 3.5.2 Documentation.
Enter n (meaning next) to run line by line.
(Pdb) n
> /working/advent-calendar-2016-python/example_fizzbuzz_buggy.py(2)<module>()
-> if ii % 3 == 0:
(Pdb)
pdb ran one line and displayed the next line to run.
The > /working/advent-calendar-2016-python/example_fizzbuzz_buggy.py (2) <module> () displayed at this time has the following format.
> File path (number of lines being executed) Function name ()
Since it is not a function this time, the function name is displayed as <module>. (Actually displays the value of \ _ \ _ name \ _ \ _)
If only ENTER (no command is specified), the previous pdb command will be executed. Therefore, if you want to process another line, enter ENTER.
(Pdb)
> /working/advent-calendar-2016-python/example_fizzbuzz_buggy.py(4)<module>()
-> elif ii % 5 == 0:
(Pdb)
You can use l (meaning list) to see where the line is currently running.
(Pdb) l
  1     for ii in range(1, 21):
  2         if ii % 3 == 0:
  3             print('Fizz')
  4  ->     elif ii % 5 == 0:
  5             print('Buzz')
  6         elif ii % 15 == 0:
  7             print('FizzBuzz')
  8         else:
  9             print(ii)
[EOF]
(Pdb)
The next line marked with -> is executed.
If you want to proceed instead of line by line, specify c (meaning continue).
(Pdb) c
1
2
Fizz
4
Buzz
Fizz
7
8
Fizz
Buzz
11
Fizz
13
14
Fizz
16
17
Fizz
19
Buzz
The program finished and will be restarted
> /working/advent-calendar-2016-python/example_fizzbuzz_buggy.py(1)<module>()
-> for ii in range(1, 21):
I ran the program to the end. When the program is processed to the end, pdb prints The program finished and will be restarted and re-executes the program.
If you want to stop processing by specifying the number of lines, use a breakpoint. To check the processing when ii is 15, use the b (meaning break) command to set a breakpoint on the second line that branches first in the if statement.
(Pdb) b 2
Breakpoint 1 at /working/advent-calendar-2016-python/example_fizzbuzz_buggy.py:2
(Pdb)
This will pause the program before the second line is processed. Let's proceed with the process using the c command.
(Pdb) c
1
> /working/advent-calendar-2016-python/example_fizzbuzz_buggy.py(2)<module>()
-> if ii % 3 == 0:
(Pdb)
It has stopped. Use the p (meaning print) command to see what the value of ii is.
(Pdb) p ii
2
(Pdb)
It's 2. I want to check the processing at 15, so let's execute c 13 more times.
(Pdb) c
2
> /working/advent-calendar-2016-python/example_fizzbuzz_buggy.py(2)<module>()
-> if ii % 3 == 0:
(Pdb) c
Fizz
> /working/advent-calendar-2016-python/example_fizzbuzz_buggy.py(2)<module>()
-> if ii % 3 == 0:
(Pdb) c
4
> /working/advent-calendar-2016-python/example_fizzbuzz_buggy.py(2)<module>()
-> if ii % 3 == 0:
(Pdb) c
Buzz
> /working/advent-calendar-2016-python/example_fizzbuzz_buggy.py(2)<module>()
-> if ii % 3 == 0:
(Pdb) c
Fizz
> /working/advent-calendar-2016-python/example_fizzbuzz_buggy.py(2)<module>()
-> if ii % 3 == 0:
(Pdb) c
7
> /working/advent-calendar-2016-python/example_fizzbuzz_buggy.py(2)<module>()
-> if ii % 3 == 0:
(Pdb) c
8
> /working/advent-calendar-2016-python/example_fizzbuzz_buggy.py(2)<module>()
-> if ii % 3 == 0:
(Pdb) c
Fizz
> /working/advent-calendar-2016-python/example_fizzbuzz_buggy.py(2)<module>()
-> if ii % 3 == 0:
(Pdb) c
Buzz
> /working/advent-calendar-2016-python/example_fizzbuzz_buggy.py(2)<module>()
-> if ii % 3 == 0:
(Pdb) c
11
> /working/advent-calendar-2016-python/example_fizzbuzz_buggy.py(2)<module>()
-> if ii % 3 == 0:
(Pdb) c
Fizz
> /working/advent-calendar-2016-python/example_fizzbuzz_buggy.py(2)<module>()
-> if ii % 3 == 0:
(Pdb) c
13
> /working/advent-calendar-2016-python/example_fizzbuzz_buggy.py(2)<module>()
-> if ii % 3 == 0:
(Pdb) c
14
> /working/advent-calendar-2016-python/example_fizzbuzz_buggy.py(2)<module>()
-> if ii % 3 == 0:
(Pdb) p ii
15
(Pdb)
In the above, c was entered many times, but you can also set the conditions to stop. This time, I want you to stop when ii is 15, so specify the conditions as follows.
(Pdb) b 2, ii == 15
Breakpoint 3 at /working/advent-calendar-2016-python/example_fizzbuzz_buggy.py:2
(Pdb)
And when you run c, it only stops when ii is 15, so you don't have to type c multiple times.
(Pdb) c
1
2
Fizz
4
Buzz
Fizz
7
8
Fizz
Buzz
11
Fizz
13
14
> /working/advent-calendar-2016-python/example_fizzbuzz_buggy.py(2)<module>()
-> if ii % 3 == 0:
(Pdb) p ii
15
(Pdb)
After that, execute n line by line and check the operation.
(Pdb) n
> /working/advent-calendar-2016-python/example_fizzbuzz_buggy.py(3)<module>()
-> print('Fizz')
(Pdb) n
Fizz
> /working/advent-calendar-2016-python/example_fizzbuzz_buggy.py(1)<module>()
-> for ii in range(1, 21):
(Pdb)
You can see that the for statement on the first line is processed after the third line is executed (that is, the ʻelif ii% 15 == 0: `on the sixth line is not processed).
(Pdb) list
  1  -> for ii in range(1, 21):
  2 B       if ii % 3 == 0:
  3             print('Fizz')
  4         elif ii % 5 == 0:
  5             print('Buzz')
  6         elif ii % 15 == 0:
  7             print('FizzBuzz')
  8         else:
  9             print(ii)
[EOF]
(Pdb)
When ii is 15, ʻii% 3 == 0` is True, so I used pdb to confirm that this if-elif-else does not work properly at 15.
(Pdb) p ii
15
(Pdb) p ii % 3 == 0
True
(Pdb)
Breakpoints are deleted using cl (meaning clear).
(Pdb) cl
Clear all breaks? yes
Deleted breakpoint 3 at /working/advent-calendar-2016-python/example_fizzbuzz_buggy.py:2
(Pdb)
To see what the called function is doing, specify s (meaning step).
example_fizzbuzz_buggy2.py::
def fizzbuzz(num):
    if ii % 3 == 0:
        print('Fizz')
    elif ii % 5 == 0:
        print('Buzz')
    elif ii % 15 == 0:
        print('FizzBuzz')
    else:
        print(ii)

for ii in range(1, 21):
    fizzbuzz(ii)
Try entering the fizzbuzz function with example_fizzbuzz_buggy2.py.
$ python -m pdb example_fizzbuzz_buggy2.py
> /working/advent-calendar-2016-python/example_fizzbuzz_buggy2.py(1)<module>()
-> def fizzbuzz(num):
(Pdb) n
> /working/advent-calendar-2016-python/example_fizzbuzz_buggy2.py(11)<module>()
-> for ii in range(1, 21):
(Pdb) n
> /working/advent-calendar-2016-python/example_fizzbuzz_buggy2.py(12)<module>()
-> fizzbuzz(ii)
(Pdb) p ii
1
So far, using the contents explained earlier, we are proceeding to the process up to the fizzbuzz () call on the 12th line.
Next, specify s to stop the process inside fizzbuzz ().
(Pdb) s
--Call--
> /working/advent-calendar-2016-python/example_fizzbuzz_buggy2.py(1)fizzbuzz()
-> def fizzbuzz(num):
(Pdb) n
> /working/advent-calendar-2016-python/example_fizzbuzz_buggy2.py(2)fizzbuzz()
-> if ii % 3 == 0:
(Pdb)
> /working/advent-calendar-2016-python/example_fizzbuzz_buggy2.py(4)fizzbuzz()
-> elif ii % 5 == 0:
To proceed to the end of the fizzbuzz () function, specify r (meaning return).
(Pdb) r
1
--Return--
> /working/advent-calendar-2016-python/example_fizzbuzz_buggy2.py(9)fizzbuzz()->None
-> print(ii)
(Pdb) n
> /working/advent-calendar-2016-python/example_fizzbuzz_buggy2.py(11)<module>()
-> for ii in range(1, 21):
fizzbuzz ()-> None indicates that fizzbuzz () returned None.
Write ʻimport pdb; pdb.set_trace () `in your code
I was running with python -m pdb to use pdb, but now I have to change the boot options. This doesn't allow you to use pdb if you're writing a startup script or don't call Python directly.
pdb provides set_trace () for that. When set_trace () is called, it switches to pdb debug mode and waits for commands.
Put set_trace () in example_fizzbuzz_buggy.py.
example_fizzbuzz_buggy.py::
for ii in range(1, 21):
    if ii % 3 == 0:
        print('Fizz')
    elif ii % 5 == 0:
        import pdb; pdb.set_trace()  #add to
        print('Buzz')
    elif ii % 15 == 0:
        print('FizzBuzz')
    else:
        print(ii)
Added ʻimport pdb; pdb.set_trace () on line 5. Run example_fizzbuzz_buggy.py, but this time do not specify -m pdb`.
$ python  example_fizzbuzz_buggy.py
1
2
Fizz
4
> /working/advent-calendar-2016-python/example_fizzbuzz_buggy.py(6)<module>()
-> print('Buzz')
(Pdb)
It stopped at the 6th line.
(Pdb) l
  1     for ii in range(1, 21):
  2         if ii % 3 == 0:
  3             print('Fizz')
  4         elif ii % 5 == 0:
  5             import pdb; pdb.set_trace()
  6  ->         print('Buzz')
  7         elif ii % 15 == 0:
  8             print('FizzBuzz')
  9         else:
 10             print(ii)
[EOF]
(Pdb)
Processing is stopped at the line following set_trace (). This method allows you to start the pdb without changing the boot options.
This debug code must be removed at the end of debugging. If you forget to delete it, pdb will start and wait for input during production operation. Unlike debugging with print (), there is always real harm. It's a good idea to check for pdb contamination with Git commit hooks and CI tests.
ʻImport pdb; pdb.set_trace ()` has two statements, one is an import statement. Normally, it is preferable to write the import statement at the beginning of the file, This debug code must be erased at the end of debugging, so It is written in one line to reduce the number of lines to be erased. This is also introduced in the official Python documentation, It is customary to write it in one line.
Debug with ipdb
ipdb is a library that extends the functionality of pdb using IPython.
install ipdb with pip.
$ pip install ipdb
Start by specifying -m ipdb as a Python startup option or by writing ʻimport ipdb; ipdb.set_trace ()` in your code.
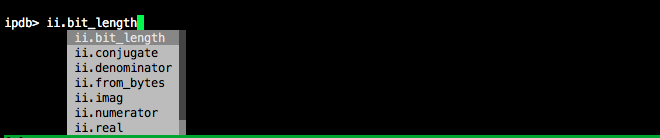
The code is highlighted and easy to see.

You can display the attribute list by pressing the tab.
Other than that, the usage is almost the same as pdb.
Debug with bpdb
bpdb is a library that extends the functionality of pdb using BPython. This is provided as a feature of BPython itself.
bpdb installs bpython with pip.
$ pip install bpython
Start by specifying -m bpdb as a Python startup option or by writing ʻimport bpdb; bpdb.set_trace ()in your code. It works the same as pdb, but typingB` launches BPython at the current stack frame.

The end of BPython is C-d.
Debug with pudb
PuDB is a powerful debugger that can be used on the console.
Install it.
pip install pudb
Once installed, you will be able to use the command pudb3 (for Python3). Start by specifying the file path you want to execute in pudb3.
$ pudb3 example_fizzbuzz_buggy.py
The debugger pane is the same as the pdb operation. You can switch between the debugger pane and the interactive shell pane with C-x.

You can set the theme etc., and the setting values are saved in ~ / .config / pudb / pudb.cfg.
~/.config/pudb/pudb.cfg::
[pudb]
breakpoints_weight = 1
current_stack_frame = top
custom_stringifier =
custom_theme =
display = auto
line_numbers = True
prompt_on_quit = True
seen_welcome = e027
shell = classic
sidebar_width = 0.5
stack_weight = 1
stringifier = type
theme = dark vim
variables_weight = 1
wrap_variables = True
Debug with PyCharm
PyCharm is a Python IDE developed by JetBrains. You can operate the debugger with GUI operations. It's very intuitive and wonderful. You can download the installer from https://www.jetbrains.com/pycharm/download/.
Open the file and try setting a breakpoint.
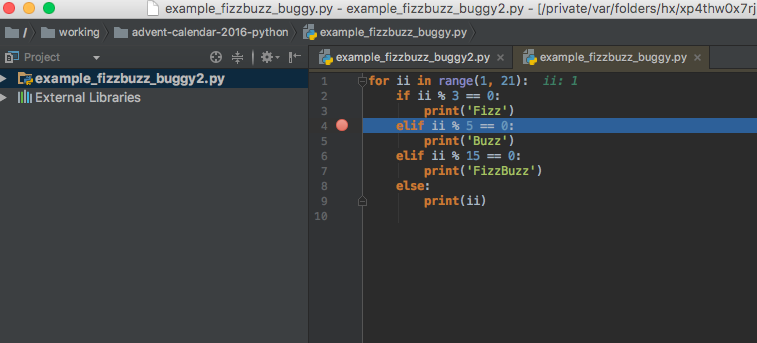
Click the right side of the line number display and a red circle will appear. This is the debugger. It's the same as VS or Eclipse.
Run from the menu [Run]> [Debug], (or bug mark )Click.

Bug mark

When executed, it will stop at the breakpoint and the stack frame and variables will be displayed in the pane.

Since the icon is enabled for detailed operations, you can operate it by clicking it, and if you mouse over it, the icon to do is displayed.

You can also use the remote debugging function in Professional Edition.
Debug in various scenes
If you want to use a debugger with unittest
If you get an error in unittest but don't know the cause, you'll want to debug with test code.
In that case, you can put pdb.set_trace () in your test code and start pdb.
For example, the following test code will start pdb when the test is executed.
test_main.py::
from unittest import TestCase


def create_message(count):
    return 'Fish: {}'.format(count)


class SimpleTest(TestCase):
    def test_it(self):
        import pdb; pdb.set_trace()  #Debug code
        msg = create_message(1)
        self.assertEqual(msg, 'Fish: 1')
Running unittest will start pdb.
$ python -m unittest
> /working/advent-calendar-2016-python/test_main.py(11)test_it()
-> msg = create_message(1)
(Pdb) list
  6
  7
  8     class SimpleTest(TestCase):
  9         def test_it(self):
 10             import pdb; pdb.set_trace()  #Debug code
 11  ->         msg = create_message(1)
 12             self.assertEqual(msg, 'Fish: 1')
[EOF]
(Pdb)
If you want to use a debugger with nose
nose is a popular testing framework.
If you want the test to be stopped in the middle using pdb as before, specify --nocapture.
$ nosetests --nocapture
> /working/advent-calendar-2016-python/test_main.py(11)test_it()
-> msg = create_message(1)
(Pdb)
It also provides --pdb, --pdb-failures, and --pdb-errors to start pdb in the event of an error or failure.
$ nosetests --pdb
> /Users/sximada/ng2/var/lib/miniconda3/envs/py3.5.2/lib/python3.5/unittest/case.py(665)fail()
-> raise self.failureException(msg)
(Pdb)
As the nose documentation says Warning nose itself supports python 3, but many 3rd-party plugins do not!
It seems that the nose plugin is not compatible with Python3, not the nose itself.
If you want to use the debugger with pytest
pytest is also a popular testing framework like nose. If you execute pytest as it is, pdb will start when set_trace () is executed.
$ pytest
================================================================================ test session starts ================================================================================
platform darwin -- Python 3.5.2, pytest-3.0.5, py-1.4.32, pluggy-0.4.0
rootdir: /working/advent-calendar-2016-python, inifile:
plugins: celery-4.0.0
collected 1 items

test_main.py
>>>>>>>>>>>>>>>>>>>>>>>>>>>>>>>>>>>>>>>>>>>>>>>>>>>>>>>>>>>>>>>>>>>>>> PDB set_trace (IO-capturing turned off) >>>>>>>>>>>>>>>>>>>>>>>>>>>>>>>>>>>>>>>>>>>>>>>>>>>>>>>>>>>>>>>>>>>>>>
> /working/advent-calendar-2016-python/test_main.py(11)test_it()
-> msg = create_message(1)
(Pdb)
You can start the debugger on error by specifying --pdb.
$ pytest --pdb
================================================================================ test session starts ================================================================================
platform darwin -- Python 3.5.2, pytest-3.0.5, py-1.4.32, pluggy-0.4.0
rootdir: /working/advent-calendar-2016-python, inifile:
plugins: celery-4.0.0
collected 2 items

test_main.py F
>>>>>>>>>>>>>>>>>>>>>>>>>>>>>>>>>>>>>>>>>>>>>>>>>>>>>>>>>>>>>>>>>>>>>>>>>>>>>>>>>>>>> traceback >>>>>>>>>>>>>>>>>>>>>>>>>>>>>>>>>>>>>>>>>>>>>>>>>>>>>>>>>>>>>>>>>>>>>>>>>>>>>>>>>>>>>

self = <test_main.SimpleTest testMethod=test_error>

    def test_error(self):
        msg = create_message(1)
>       self.assertEqual(msg, 'ERROR')
E       AssertionError: 'Fish: 1' != 'ERROR'
E       - Fish: 1
E       + ERROR

test_main.py:15: AssertionError
>>>>>>>>>>>>>>>>>>>>>>>>>>>>>>>>>>>>>>>>>>>>>>>>>>>>>>>>>>>>>>>>>>>>>>>>>>>>>>>>>>> entering PDB >>>>>>>>>>>>>>>>>>>>>>>>>>>>>>>>>>>>>>>>>>>>>>>>>>>>>>>>>>>>>>>>>>>>>>>>>>>>>>>>>>>>
> /Users/sximada/ng2/var/lib/miniconda3/envs/py3.5.2/lib/python3.5/unittest/case.py(665)fail()
-> raise self.failureException(msg)
(Pdb)
If you want to use a debugger with Django
Django is a popular web framework.
Using pdb with Django
If it's a development server (manage.py runserver), nothing is difficult.
Create a project and start pdb.
The structure of the project is as follows.
$ tree proj
proj
├── __init__.py
├── settings.py
├── urls.py
└── wsgi.py
The proj / urls.py is written as follows.
from django.conf.urls import url
from django.http import HttpResponse


def top_view(request):
    import pdb; pdb.set_trace()
    return HttpResponse('OK')

urlpatterns = [
    url(r'^$', top_view),
]
I have defined a View that returns a request with ʻOK when accessing / `.
(Since it was troublesome to split the file, view is also described in urls.py)
Pdb.set_trac () is described in the View function.
Start the development server with runserver.
$ python manage.py runserver
Performing system checks...

System check identified no issues (0 silenced).
December 24, 2016 - 13:45:26
Django version 1.11.dev20161224024349, using settings 'proj.settings'
Starting development server at http://127.0.0.1:8000/
Quit the server with CONTROL-C.
Send a request to the URL.
$ curl http://127.0.0.1:8000/
The development server starts pdb with pdb.set_trace () and waits for input.
> /working/advent-calendar-2016-python/proj/urls.py(7)top_view()
-> return HttpResponse('OK')
(Pdb)
All you have to do is debug. You can also check the contents of the request object. Other WAFs can often be debugged with pdb as well.
If you want to use the debugger with gunicorn
gunicorn is a popular WSGI HTTP Server. Run the Django Project earlier at gunicorn.
$ gunicorn proj.wsgi:application
[2016-12-24 22:53:59 +0900] [8915] [INFO] Starting gunicorn 19.6.0
[2016-12-24 22:53:59 +0900] [8915] [INFO] Listening at: http://127.0.0.1:8000 (8915)
[2016-12-24 22:53:59 +0900] [8915] [INFO] Using worker: sync
[2016-12-24 22:53:59 +0900] [8918] [INFO] Booting worker with pid: 8918
Send a request to the URL.
$ curl http://127.0.0.1:8000/
pdb.set_trace () starts pdb.
> /working/advent-calendar-2016-python/proj/urls.py(7)top_view()
-> return HttpResponse('OK')
(Pdb)
It's the same as Django's development server.
Watch out for timeouts
Gunicorn has a setting to time out the request, which is 30 seconds by default. Display (Pdb) [2016-12-24 23:09:37 +0900] [9102] [CRITICAL] WORKER TIMEOUT (pid: 9115) while starting pdb and debugging
If the pdb terminates, the request is treated as a timeout, so set a large timeout value with --timeout and execute.
$ gunicorn proj.wsgi:application --timeout 9999999
[2016-12-24 23:13:11 +0900] [9126] [INFO] Starting gunicorn 19.6.0
[2016-12-24 23:13:11 +0900] [9126] [INFO] Listening at: http://127.0.0.1:8000 (9126)
[2016-12-24 23:13:11 +0900] [9126] [INFO] Using worker: sync
[2016-12-24 23:13:11 +0900] [9130] [INFO] Booting worker with pid: 9130
> /working/advent-calendar-2016-python/proj/urls.py(7)top_view()
-> return HttpResponse('OK')
(Pdb)
If you want to use the debugger with Celery
Celery is a commonly used task queue. I will use Redis as a broker this time, so start it.
$ nohup redis-server 2>&1 > /dev/null &
[1] 9384
Create tasks.py and define the add () task. This time we want to debug this add () task.
tasks.py::
from celery import Celery

app = Celery('tasks', broker='pyamqp://guest@localhost//')

@app.task
def add(x, y):
    import pdb; pdb.set_trace()
    return x + y
Start worker.
$ celery -A tasks.app worker

 -------------- [email protected] v4.0.0 (latentcall)
---- **** -----
--- * ***  * -- Darwin-16.1.0-x86_64-i386-64bit 2016-12-24 23:23:27
-- * - **** ---
- ** ---------- [config]
- ** ---------- .> app:         tasks:0x1042b4940
- ** ---------- .> transport:   redis://127.0.0.1:6379//
- ** ---------- .> results:     disabled://
- *** --- * --- .> concurrency: 4 (prefork)
-- ******* ---- .> task events: OFF (enable -E to monitor tasks in this worker)
--- ***** -----
 -------------- [queues]
                .> celery           exchange=celery(direct) key=celery
Fire the task in another terminal.
>>> import tasks
>>> tasks.add.delay(1, 2)
<AsyncResult: a07399f4-e28a-4471-b57d-30ce1cb3abf4>
>>>
I get a bdb.BdbQuit exception in the terminal running the worker.
[2016-12-24 23:24:50,006: WARNING/PoolWorker-4] > /working/advent-calendar-2016-python/tasks.py(9)add()
-> return x + y
[2016-12-24 23:24:50,007: WARNING/PoolWorker-4](Pdb)
[2016-12-24 23:24:50,061: ERROR/PoolWorker-4] Task tasks.add[a07399f4-e28a-4471-b57d-30ce1cb3abf4] raised unexpected: BdbQuit()
Traceback (most recent call last):
  File "/Users/sximada/ng2/var/lib/miniconda3/envs/py3.5.2/lib/python3.5/site-packages/celery/app/trace.py", line 368, in trace_task
    R = retval = fun(*args, **kwargs)
  File "/Users/sximada/ng2/var/lib/miniconda3/envs/py3.5.2/lib/python3.5/site-packages/celery/app/trace.py", line 623, in __protected_call__
    return self.run(*args, **kwargs)
  File "/working/advent-calendar-2016-python/tasks.py", line 9, in add
    return x + y
  File "/working/advent-calendar-2016-python/tasks.py", line 9, in add
    return x + y
  File "/Users/sximada/ng2/var/lib/miniconda3/envs/py3.5.2/lib/python3.5/bdb.py", line 48, in trace_dispatch
    return self.dispatch_line(frame)
  File "/Users/sximada/ng2/var/lib/miniconda3/envs/py3.5.2/lib/python3.5/bdb.py", line 67, in dispatch_line
    if self.quitting: raise BdbQuit
bdb.BdbQuit
Actually, how to debug Celery is described at http://docs.celeryproject.org/en/latest/userguide/debugging.html. You can't use pdb as is, you have to use celery.contrib.rdb and use the debugger via telnet. Modify tasks.py.
tasks.py::
from celery import Celery
from celery.contrib import rdb

app = Celery('tasks', broker='redis://127.0.0.1/')


@app.task
def add(x, y):
    rdb.set_trace()
    return x + y
Reignite the task.
>>> import tasks
>>> tasks.add.delay(1,2)
<AsyncResult: 42b88871-a679-492f-bfc9-1f86043dab33>
>>>
The worker will then display the message Remote Debugger: 6900: Waiting for client ....
Access this port number via telnet.
$ telnet 127.0.0.1 6900
Trying 127.0.0.1...
Connected to localhost.
Escape character is '^]'.
> /working/advent-calendar-2016-python/tasks.py(10)add()
-> return x + y
(Pdb) p x
1
(Pdb) p y
2
(Pdb)
pdb is waiting for input. The rest is the same as the operation of pdb. The worker closes the port when the task finishes. If you run it multiple times, you will have to telnet back each time.
In the case of Celery, add (1, 2) will execute a normal function, so it is also a good idea to debug with that. However, Celery's code is still executed, so if you make it executable as a function that is not a task, It will be easier to isolate whether it is a Celery problem.
If you want to use the debugger with jupyter notebook
The jupyter notebook provides a % debug magic command that allows you to start the pdb.
The following is debugging requests.get ('http://example.com') with pdb.

If you want to use a debugger on CircleCI
Circle CI is a popular CI service.
Sometimes a test running on Circle CI fails and the cause cannot be determined.
In that case, if you select Rebuild with SSH to build, you can log in to the build container with SSH and check the behavior.

I have cloned the repository to my home directory, so I put pdb.set_trace () in the code there
Running the test manually makes it easier to determine the cause of the error.
If you want to use the debugger in the staging environment
This is not limited to Python, but if you have a staging environment where you can log in with ssh, You want to run pdb on a staging environment, right?
For example, a Django application Write pdb.set_trace () on staging and manually start the development server with an appropriate port number. It is quick to connect to the development server with ssh port forward.
[staging]$ python manage.py runserver 4649
Connect localhost: 8000 to staging: 4649 with ssh port forward.
$ ssh -L 8000:localhost:4649 staging
Then send the request as if you were testing on localhost.
If you want to use a debugger in a production environment
Let's absolutely stop. I have an accident (declaration). If you have an RC environment, you may do it, but Still, if you don't pay close attention, you won't be able to see it.
Recommended Posts