Hyogo Prefecture's Corona Candlestick Chart App has been released.
Published service
https://covid19-candle-hyogo.ml The source code of GitHub is here
Motivation
Published daily infected person graphs and cumulative graphs Those who have recovered or died will not be deducted I think it only gives the feeling of always expanding.
Like myself What I want to know is rather "trend" Is it expanding, ending, or in equilibrium?
Excel data of here which is open data of Hyogo prefecture The number of people who are hospitalized is the actual number of positive people in the prefecture. There was a day when there were -20 people compared to the previous day, In fact, the number of real positives is increasing or decreasing.
I also had experience in the development language of an automatic currency trading tool called mql. I thought that by applying the candlestick chart of the exchange rate, it would be possible to visualize the tendency of the spread of infection.
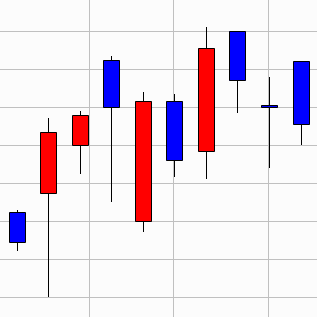
What is a candlestick chart?
It is a graph often used to analyze exchange rates and stock price movements.
Is the price rising or falling?
The rise and fall are very visually easy to understand, from the use in the rice market in the Edo period to the present
This is the chart used.
By the way, it originated in Japan.
Container configuration
scraping-bot Language: python Description: Download the Hyogo Prefecture homepage excel file into the container every 30 minutes Store data in postgreSQL
gqlkit-server Language: Go Package: gqlgen Description: GraphQL server, scraping-Read data stored by bot container from postgreSQL Serve as GraphQL Query
nuxt Language: javascript Description: Receives data from GraphQL provided by gqlkit-server Draw a candlestick chart using echarts.js. Also, depending on the order of the candlesticks, the 5-day average line, and the 10-day average line. It also displays alerts that assess the extent of the spread. GraphQL client uses rapi
** Other containers ** postgres pgweb (for database confirmation)
Summary
This time, I used the VPS of mixhost as the server. The reception seems to be until the end of April, but when publishing corona related apps and sites It can be used free of charge for 12 months. As long as thank you