[PYTHON] Time series analysis # 6 Spurious regression and cointegration
1. Overview
- Continuing from Part 5, I am studying based on "Measurement time series analysis of economic and financial data".
- This article is about spurious regression and cointegration in Chapter 6.
2. Spurious regression
Definition
There seems to be a significant relationship between $ x_t $ and $ y_t $ when regressing $ y_t = \ alpha + \ beta x_t + \ epsilon_t $ for two unrelated unit root processes $ x_t $ and $ y_t $. The phenomenon that looks like is called spurious regression.
Verification
- Two independent processes
$ \ qquad x_t = x_ {t-1} + \ epsilon_ {x, t}, \ quad \ epsilon_ {x, t} \ sim iid (0, \ sigma_x ^ 2) $
$ \ qquad y_t = y_ {t-1} + \ epsilon_ {y, t}, \ quad \ epsilon_ {y, t} \ sim iid (0, \ sigma_y ^ 2) $
$ \ qquad y_t = \ alpha + \ beta x_t + \ epsilon_t $
Return to the model.
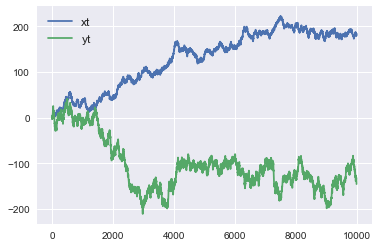
#Data generation
sigma_x, sigma_y = 1, 2
T = 10000
xt = np.cumsum(np.random.randn(T) * sigma_x).reshape(-1, 1)
yt = np.cumsum(np.random.randn(T) * sigma_y).reshape(-1, 1)
- When plotted, it looks like the following.
- First, regression was performed with scikit-learn.
from sklearn.linear_model import LinearRegression
reg = LinearRegression().fit(xt,yt)
print('R-squared : ',reg.score(xt,yt))
print('coef : ',reg.coef_, 'intercept', reg.intercept_)
R-squared : 0.4794854506874714
coef : [[-0.62353254]] intercept [-24.27600549]
- The coefficient of determination ($ R ^ 2 $) was 0.479, which was reasonably high. For the regression model, it was in the form of $ \ alpha = -24.28, \ quad \ beta = -0.6235 $.
- To test whether $ x_t $ and $ y_t $ are independent, we want to test $ H_0: \ beta = 0 $. However, scikit-learn didn't find that much functionality.
- When I searched for other libraries, statsmodels seemed to be useful, so I regressed with statsmodels again.
import statsmodels.api as sm
reg = sm.OLS(yt,sm.add_constant(xt,prepend=False)).fit()
reg.summary()
|
|
|
|
| Dep. Variable: |
y |
R-squared: |
0.479 |
| Model: |
OLS |
Adj. R-squared: |
0.479 |
| Method: |
Least Squares |
F-statistic: |
9210. |
| Date: |
Tue, 07 Jan 2020 |
Prob (F-statistic): |
0.00 |
| Time: |
22:36:57 |
Log-Likelihood: |
-51058. |
| No. Observations: |
10000 |
AIC: |
1.021e+05 |
| Df Residuals: |
9998 |
BIC: |
1.021e+05 |
| Df Model: |
1 |
|
|
| Covariance Type: |
nonrobust |
|
|
|
coef |
std err |
t |
P>abs(t) |
[0.025 |
0.975] |
| const |
-24.2760 |
0.930 |
-26.113 |
0.000 |
-26.098 |
-22.454 |
| x1 |
-0.6235 |
0.006 |
-95.968 |
0.000 |
-0.636 |
-0.611 |
- add_constant is related to whether to include a constant term ($ \ alpha $ in the regression equation) in the regression model. By doing add_constant, the constant term will be included in the regression model. In the case of scikit-learn, if the argument fit_intercept is set to False, the regression will have no constant term. This is not specified above, because fit_intercept = True is the default value.
- As with scikit-learn, the coefficient of determination was 0.479, $ \ alpha = -24.28, \ quad \ beta = -0.6235 $, confirming that equivalent regression was achieved.
- The nice thing about statsmodels is that they give us 95% significance. Looking at this, for $ H_0: \ beta = 0 $, $ H_0 $ will be rejected because it must be -0.636 or more and -0.611 or less at the 95% significance level. This is a spurious regression.
How to avoid
Include lag variables in the model
- Change the regression model as follows.
$ \ qquad y_t = \ alpha + \ beta_1 x_t + \ beta_2 y_ {t-1} + \ epsilon_t $
$ y_ {t-1} $ is added to the explanatory variable of $ y_t $.
When regressing using stats models, it becomes as follows. sm.OLS takes explained variables and explanatory variables as arguments, but it is necessary to feed the explanatory variables together in one array as shown below.
x_t, y_t, y_t_1 = xt[1:], yt[1:], yt[:-1]
X = np.column_stack((x_t, y_t_1))
reg = sm.OLS(y_t,sm.add_constant(X)).fit()
reg.summary()
|
|
|
|
| Dep. Variable: |
y |
R-squared: |
0.999 |
| Model: |
OLS |
Adj. R-squared: |
0.999 |
| Method: |
Least Squares |
F-statistic: |
3.712e+06 |
| Date: |
Thu, 09 Jan 2020 |
Prob (F-statistic): |
0.00 |
| Time: |
22:12:59 |
Log-Likelihood: |
-21261. |
| No. Observations: |
9999 |
AIC: |
4.253e+04 |
| Df Residuals: |
9996 |
BIC: |
4.255e+04 |
| Df Model: |
2 |
|
|
| Covariance Type: |
nonrobust |
|
|
|
coef |
std err |
t |
P>abs(t) |
[0.025 |
0.975] |
| const |
-0.0815 |
0.049 |
-1.668 |
0.095 |
-0.177 |
0.014 |
| x1 |
-0.0004 |
0.000 |
-0.876 |
0.381 |
-0.001 |
0.000 |
| x2 |
0.9989 |
0.001 |
1964.916 |
0.000 |
0.998 |
1.000 |
- In the previous model, the result was $ \ alpha = -0.0815, \ quad \ beta_1 = -0.0004, \ quad \ beta_2 = 0.9899 $. $ \ Alpha $ and $ \ beta_1 $ are almost 0, most of which can be explained by $ y_ {t-1} $. And the correlation coefficient is 0.999, which is as close to 1 as possible. Also note that $ H_0: \ beta_1 = 0 $ is not rejected.
Regression after taking the difference of the unit root process and making it a stationary process
- Change the regression model as follows.
$ \ qquad \ Delta y_t = \ alpha + \ beta \ Delta x_t + \ epsilon_t $
x_t, y_t = np.diff(xt.flatten()).reshape(-1,1), np.diff(yt.flatten()).reshape(-1,1)
reg = sm.OLS(y_t,sm.add_constant(x_t)).fit()
reg.summary()
|
|
|
|
| Dep. Variable: |
y |
R-squared: |
0.000 |
| Model: |
OLS |
Adj. R-squared: |
0.000 |
| Method: |
Least Squares |
F-statistic: |
3.297 |
| Date: |
Thu, 09 Jan 2020 |
Prob (F-statistic): |
0.0694 |
| Time: |
22:33:26 |
Log-Likelihood: |
-21262. |
| No. Observations: |
9999 |
AIC: |
4.253e+04 |
| Df Residuals: |
9997 |
BIC: |
4.254e+04 |
| Df Model: |
1 |
|
|
| Covariance Type: |
nonrobust |
|
|
| coef |
std err |
t |
P>abs(t) |
[0.025 |
0.975] |
| const |
-0.0138 |
0.020 |
-0.681 |
0.496 |
-0.054 |
| x1 |
-0.0374 |
0.021 |
-1.816 |
0.069 |
-0.078 |
- In this case, the correlation coefficient is 0, which is almost 0 at $ \ beta = -0.0374 $. It is also not possible to reject $ H_0: \ beta_1 = 0 $, leading to the conclusion that there is no significant relationship between $ \ Delta x_t $ and $ \ Delta y_t $.
3. Cointegration
Definition
- Let $ x_t $ and $ y_t $ be the unit root process ($ \ rm I (1) $). At this time, when $ a $ and $ b $, which are stationary processes, exist like $ a x_t + by_t \ sim \ rm I (0) $, there is a cointegration relationship between $ x_t $ and $ y_t $. There is. Also, $ (a, b)'$ is called a cointegration vector.
- More generally, for $ \ mathbb y_t \ sim \ rm I (1) $, there exists $ \ mathbb a $ such that $ \ mathbb a'\ mathbb y_t \ sim \ rm I (0) $ Then, $ \ mathbb y_t $ has a cointegration relationship. Also, $ \ mathbb a $ is called a cointegration vector.
- For example, $ u_ \ {1t}, u_ \ {2t} $ is an independent stationary process, and $ w_ \ {1t}, w_ \ {2t} $ is an independent unit root process.
$ \ qquad \ left \ {\ begin {array} {ll} x_t = \ alpha w_ \ {1t} + u_ \ {1t} \\ y_t = \ beta w_ \ {1t} + u_ \ {2t} \ end { Consider array} \ right. $
. At this time, both $ x_t $ and $ y_t $ are in the $ \ rm I (1) $ process, but
$ \ qquad x_t-\ frac {\ alpha} {\ beta} y_t = u_ {1t}-\ Since frac {\ alpha} {\ beta} u_ {2t} \ sim \ rm I (0) $
, there is a cointegration relationship between $ x_t $ and $ y_t $, and the cointegration vector is . (1,-\ frac {\ alpha} {\ beta})'.
Implication
- When $ x_t $ and $ y_t $ are unit root processes, the error in long-term prediction of $ x_t $ and $ y_t $ becomes large.
- However, if there is a cointegration between $ x_t $ and $ y_t $, then there exists $ a $ such that $ z_t = y_t --a x_t $ is a stationary process, and then $ z_t $ is long-term It is possible to make accurate predictions with a certain degree of accuracy.
Granger Representation theorem
- The VAR model including the cointegration relationship can be expressed by the vector error correction model (VECM).
- For the republican system $ \ mathbb y_t $ with VAR (p) representation,
$ \ qquad \ begin {align} \ Delta \ mathbb y_t & = \ zeta_1 \ Delta \ mathbb y_ {t-1} + \ zeta_2 \ Delta \ mathbb y_ {t-2} + \ cdots + \ zeta_ {p-1} \ Delta \ mathbb y_ {t-p + 1} + \ mathbb \ alpha + \ zeta_0 \ Delta \ mathbb y_ {t- 1} + \ epsilon_t \\ & = \ zeta_1 \ Delta \ mathbb y_ {t-1} + \ zeta_2 \ Delta \ mathbb y_ {t-2} + \ cdots + \ zeta_ {p-1} \ Delta \ mathbb y_ {t-p + 1} + \ mathbb \ alpha +-\ mathbb B \ mathbb A'\ mathbb y_ {t-1} + \ epsilon_t \ end {align} $
with VECM (p-1) Can be expressed.
- $-\ mathbb B \ mathbb A'\ mathbb y_ {t-1} $ is called the error correction term. Here, $ \ mathbb A $ represents the cointegration vector, and the error correction term indicates that the force to return to the equilibrium works when the deviation from the equilibrium becomes large.