Python-Draws a curve with equal Mahalanobis distance from two datasets
Source
MahalanobisDistance.py
import numpy as np
import matplotlib.pyplot as plt
from sympy import *
CENTER1 = np.array([2.0, 3.0])
CENTER2 = np.array([-4.0, -1.0])
def calc_sum_of_square(data_list1, data_list2):
return (len(data_list1) * sum([data1 * data2 for data1, data2 in zip(data_list1, data_list2)]) - sum(data_list1) * sum(data_list2))/(len(data_list1)*(len(data_list1)-1))
#Covariance matrix calculation
def calc_variance_covariance_matrix(data_list):
return [[calc_sum_of_square(data_list1, data_list2)/(len(data_list1)-1) for data_list1 in data_list]
for data_list2 in data_list]
def calc_average(data):
return sum(data) / len(data)
if __name__ == "__main__":
#Generate 50 random points centered on CENTER1
data_set1 = CENTER1 + 3.0 * np.random.rand(50, 2)
#Generate 50 random points centered on CENTER2
data_set2 = CENTER2 + 4.7 * np.random.rand(50, 2)
X1 = []
Y1 = []
X2 = []
Y2 = []
for data1, data2 in zip(data_set1, data_set2):
X1.append(data1[0])
Y1.append(data1[1])
X2.append(data2[0])
Y2.append(data2[1])
# data_Calculate the variance-covariance of x and y in set1
vc1 = np.array(calc_variance_covariance_matrix([X1, Y1]))
# data_Calculate the variance-covariance of x and y in set2
vc2 = np.array(calc_variance_covariance_matrix([X2, Y2]))
det1 = vc1[0][0]*vc1[1][1] - vc1[0][1]**2
det2 = vc2[0][0]*vc2[1][1] - vc2[0][1]**2
x1_ave = calc_average(X1)
y1_ave = calc_average(Y1)
x2_ave = calc_average(X2)
y2_ave = calc_average(Y2)
# data_Mahalanobis distance of set1: D1^2 = a11*x^2 + a22*y^2 + a12 * x * y + a1 * x + a2 * y + a0
a11 = vc1[1][1]/det1
a22 = vc1[0][0]/det1
a12 = -2*vc1[0][1]/det1
a1 = 2*(vc1[0][1]*y1_ave - vc1[1][1]*x1_ave)/det1
a2 = 2*(vc1[0][1]*x1_ave - vc1[0][0]*y1_ave)/det1
a0 = (vc1[1][1]*x1_ave**2 + vc1[0][0]*y1_ave**2 - 2*vc1[0][0]*x1_ave*y1_ave)/det1
# data_Mahalanobis distance of set2: D1^2 = b11*x^2 + b22*y^2 + b12 * x * y + b1 * x + b2 * y + b0
b11 = vc2[1][1]/det2
b22 = vc2[0][0]/det2
b12 = -2*vc2[0][1]/det2
b1 = 2*(vc2[0][1]*y2_ave - vc2[1][1]*x2_ave)/det2
b2 = 2*(vc2[0][1]*x2_ave - vc2[0][0]*y2_ave)/det2
b0 = (vc2[1][1]*x2_ave**2 + vc2[0][0]*y2_ave**2 - 2*vc2[0][0]*x2_ave*y2_ave)/det2
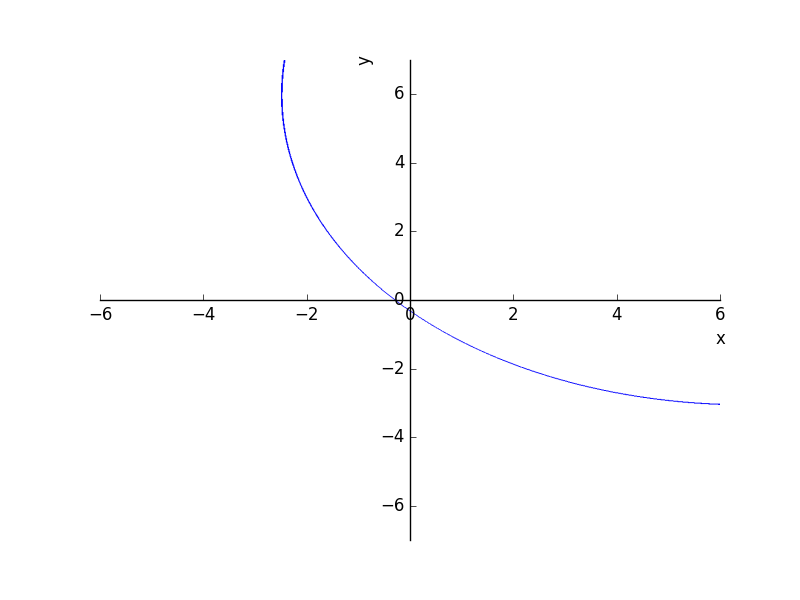
# data_set1 and data_Draw a curve at the same distance in set2
x, y = symbols("x y")
f = (a11 - b11) * x**2 + (a22 - b22) * y**2 + (a12 - b12) * x * y + (a1 - b1) * x + (a2 - b2) * y + a0 - b0
plot_implicit(f, (x, -6, 6), (y, -7, 7))
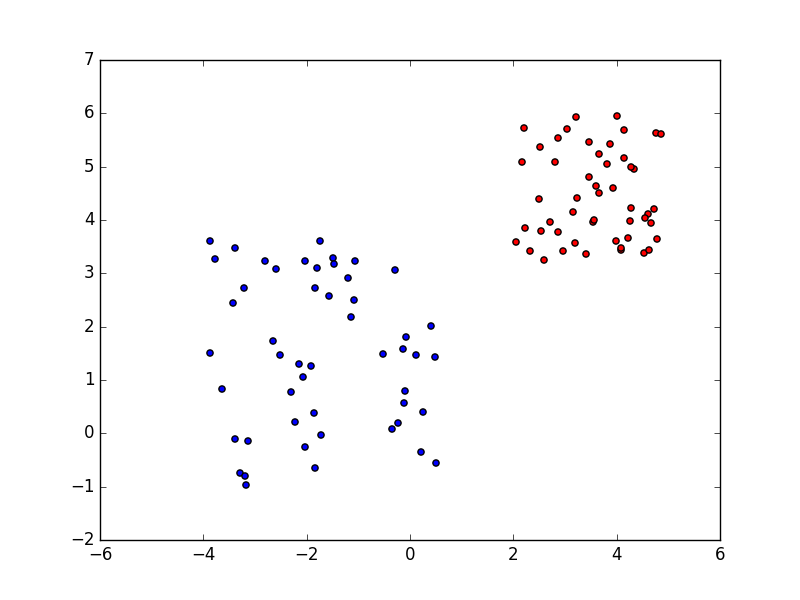
# data_set1 and data_Draw a scatter plot of set2
fig = plt.figure()
ax = fig.add_subplot(1,1,1)
ax.scatter(X1, Y1, c='red')
ax.scatter(X2, Y2, c='blue')
plt.show()
result