[Capacity indicator, Gantt chart, UI] Plotly dynamic visualization [python, gauge display, Gantt chart]
python==3.8 plotly==4.10.0
Introducing indicators and Gantt charts as tips to help you create a dashboard
indicator
Basic
To display the indicator, from the indicator of graph_objects
import plotly.graph_objects as go
fig = go.Figure()

fig.add_trace(go.Indicator(
    mode = "number+delta",
    value = 300,
    number = {'prefix': "$"},
    delta = {'position': "top", 'reference': 320}))
fig.show()

It can also be displayed above the figure
import plotly.graph_objects as go

fig = go.Figure(go.Indicator(
    mode = "number+delta",
    value = 400,
    number = {'prefix': "$"},
    delta = {'position': "top", 'reference': 320},
    domain = {'x': [0, 1], 'y': [0, 1]}))

fig.add_trace(go.Scatter(
    y = [325, 324, 405, 400, 424, 404, 417, 432, 419, 394, 410, 426, 413, 419, 404, 408, 401, 377, 368, 361, 356, 359, 375, 397, 394, 418, 437, 450, 430, 442, 424, 443, 420, 418, 423, 423, 426, 440, 437, 436, 447, 460, 478, 472, 450, 456, 436, 418, 429, 412, 429, 442, 464, 447, 434, 457, 474, 480, 499, 497, 480, 502, 512, 492]))

#fig.update_layout(paper_bgcolor = "lightgray")

fig.show()

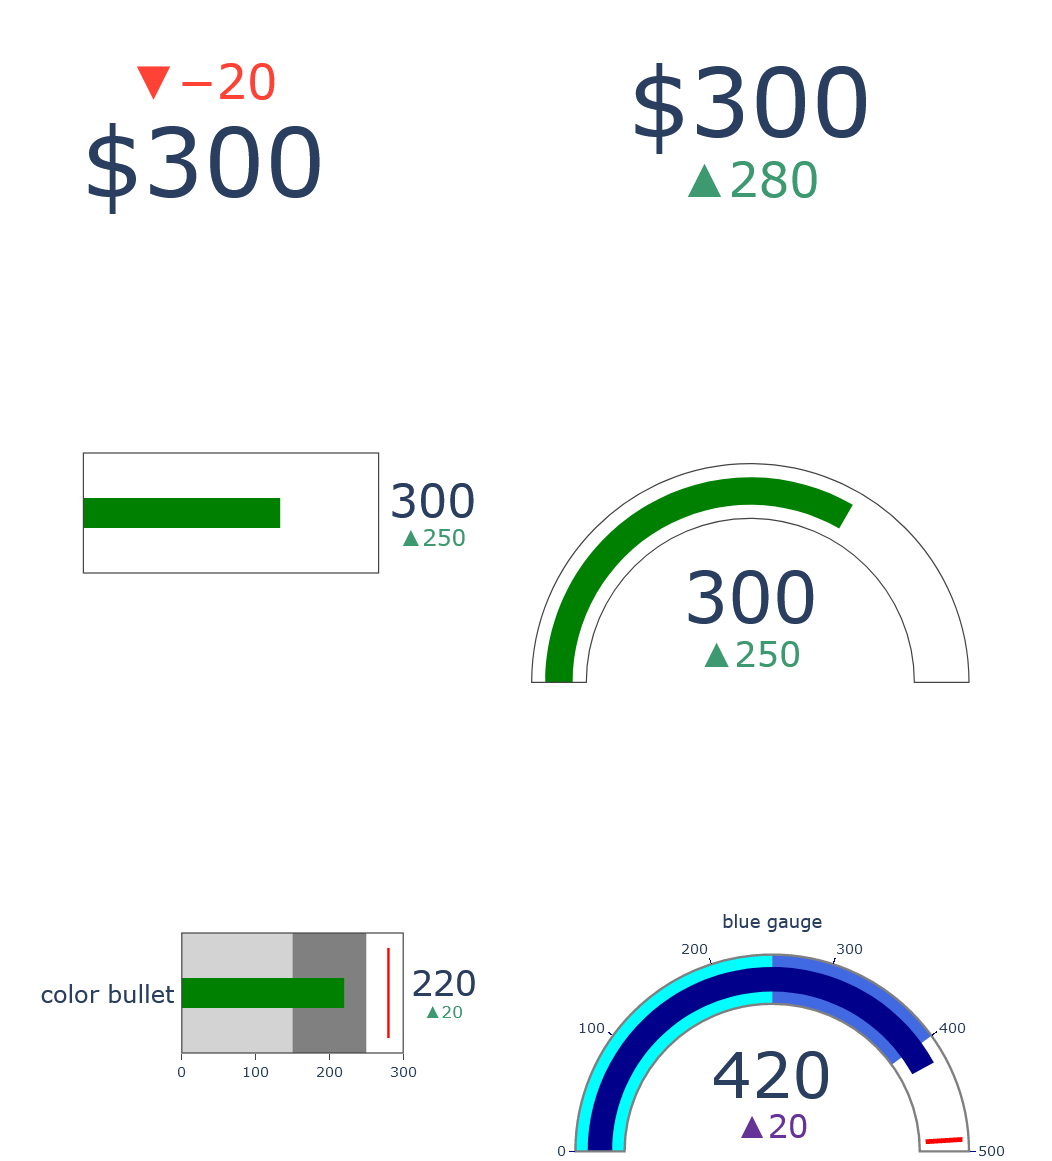
Display with a gauge up to full
Select whether to display only numbers, triangles, or gauges in mode The number of the triangle shows the difference from reference to value specified in delta Specify how many rows and columns to display in domain When specifying a gauge, specify in x and y where the gauge starts in the display area and how far it is displayed. The color display of the gauge is specified from the color of steos and bar How many rows and columns to create is created by specifying grid from update Note that the number of col and row is different from domain I tried playing with it in various ways, so please check it while referring to it.
import plotly.graph_objects as go

fig = go.Figure()

#down

fig.add_trace(go.Indicator(
    mode = "number+delta",
    value = 300,
    number = {'prefix': "$"},
    delta = {'position': "top", 'reference': 320},
    domain = {'row': 0, 'column': 0}))

#up

fig.add_trace(go.Indicator(
    mode = "number+delta",
    value = 300,
    number = {'prefix': "$"},
    delta = {'position': "bottom", 'reference': 20},
    domain = {'row': 0, 'column': 1}))

#bullet

fig.add_trace(go.Indicator(
    mode = "number+gauge+delta",
    value = 300,
    delta = {'position': "bottom", 'reference': 50},
    gauge = {'shape': "bullet",'axis' : {'visible': False}},
    domain = {'x': [0.1,0.5],'y':[0.5,0.6],'row': 1, 'column': 0}))

#gurge
fig.add_trace(go.Indicator(
    mode = "number+gauge+delta",
    value = 300,
    delta = {'position': "bottom", 'reference': 50},
    gauge = {'axis' : {'visible': False}},
    domain = {'row': 1, 'column': 1}))

#color bullet

fig.add_trace(go.Indicator(
    mode = "number+gauge+delta", value = 220,
    domain = {'x': [0.2, 0.5], 'y': [0.1, 0.2],'row': 2, 'column': 1},
    title = {'text' :"color bullet"},
    delta = {'reference': 200},
    gauge = {
        'shape': "bullet",
        'axis': {'range': [None, 300]},
        'threshold': {
            'line': {'color': "red", 'width': 2},
            'thickness': 0.75,
            'value': 280},
        'steps': [
            {'range': [0, 150], 'color': "lightgray"},
            {'range': [150, 250], 'color': "gray"}]}))

#blue gauge

fig.add_trace(
    go.Indicator(
    mode = "gauge+number+delta",
    value = 420,
    domain = {'x': [0.6, 1], 'y': [0, 0.2],'row': 2, 'column': 1},
    title = {'text': "blue gauge", 'font': {'size': 15}},
    delta = {'reference': 400, 'increasing': {'color': "RebeccaPurple"}},
    gauge = {
        'axis': {'range': [None, 500],
        'tickwidth': 1,
        'tickcolor': "darkblue"},
        'bar': {'color': "darkblue"},
        'bgcolor': "white",
        'borderwidth': 2,
        'bordercolor': "gray",
        'steps': [
            {'range': [0, 250], 'color': 'cyan'},
            {'range': [250, 400], 'color': 'royalblue'}],
        'threshold': {
            'line': {'color': "red", 'width': 4},
            'thickness': 0.75,
            'value': 490}})
)

fig.update_layout(
    grid = {'rows': 3, 'columns': 2, 'pattern': "independent"})

fig.update_layout(height = 1000 ,width = 900, margin = {'t':0, 'b':0, 'l':0})
fig.show()
Gantt chart
Data preparation
Set the column names to Task, Start, Finish, Complete

Check progress rate
from plotly.figure_factory import create_gantt
import pandas as pd

df = pd.DataFrame([['Run', '2010-01-01', '2011-02-02', 10],
                   ['Fast', '2011-01-01', '2012-06-05', 55],
                   ['Eat', '2012-01-05', '2013-07-05', 94]],
                  columns=['Task', 'Start', 'Finish', 'Complete'])

fig = create_gantt(df, colors='Blues', index_col='Complete',
                   show_colorbar=True, bar_width=0.5,
                   showgrid_x=True, showgrid_y=True)

fig.show()
The period display is week and year. Can be changed to the moon with a button
When the progress status rate "Complete" is given as a number, it is displayed as a gradation.

Confirmation of completion status
from plotly.figure_factory import create_gantt
import pandas as pd

df = pd.DataFrame([['Run', '2010-01-01', '2011-02-02', 'Complete'],
                   ['Fast', '2011-01-01', '2012-06-05', 'Not Complete'],
                   ['Eat', '2012-01-05', '2013-07-05', 'Stopped']],
                  columns=['Task', 'Start', 'Finish', 'Resource'])

fig = create_gantt(df, index_col='Resource', show_colorbar=True,
                      group_tasks=True)

fig.show()
Displayed in different colors when given as characters to the state "Resource"

that's all
Dashboard speeds up
Recommended Posts