[PYTHON] Matplotlib Basics / Differences between fig and axes
Overview Since the figure and add_subplot of matplotlib are magical in me, I will summarize them in an article to deepen my understanding.
The following import is assumed.
import matplotlib.pyplot as plt
Figure In matplotlib, the following magic is often described at the beginning.
fig = plt.figure()
figure () creates a Figure instance that reserves the entire drawing area. Image of preparing a large canvas or whiteboard.
argument
It can be used without arguments, but the following arguments can be specified.
| argument | processing |
|---|---|
| figsize | Specify drawing size in tuple format The unit is inches |
| dpi | Specify the number of dots per inch |
| facecolor | Specify background color |
| edgecolor | Specify the border color The default border width is 0.0, so linewidth is required |
| linewidth | Specify the border width |
Axes(add_subplot) I often see the following magic at the beginning.
fig = plt.figure()
ax = fig.add_subplot(1,1,1)
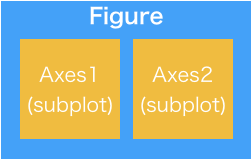
ʻAdd_subplot` creates a graph drawing area on the entire drawing area Figure. An image of pasting paper on a whiteboard and drawing a graph on the paper. The instance created at this time is a little complicated with the ** Axes ** class.
The relationship image between Figure and Axes (subplot) is as follows.
argument
The argument of add_subplot is specified for the following purposes.
| argument | processing |
|---|---|
| The first one | Specify the number of lines |
| Second | Specify the number of columns |
| Third | Specify the drawing location |
Divide the previously generated figure by the number of matrices specified in the first and second, and draw the graph in the place specified in the third.
For example, ʻadd_subplot (3,3,5) specifies the middle cell of the Figure divided by 3x3.

By the way, ʻadd_subplot (1,1,1) is synonymous with ʻadd_subplot (111).
Try to describe
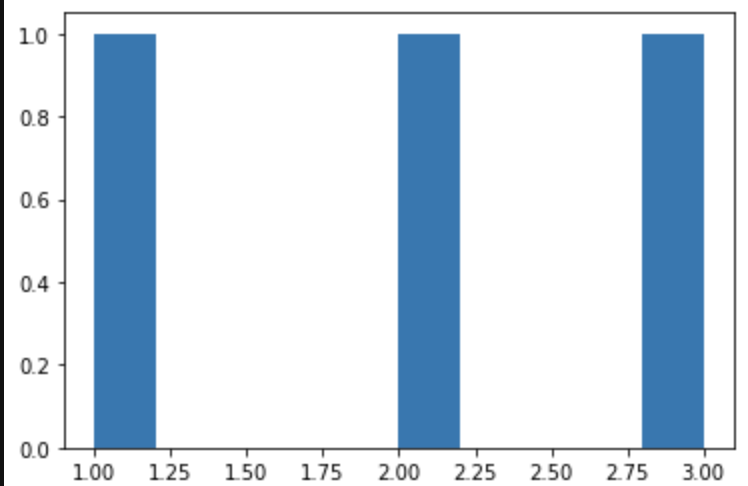
Once you understand this, all you have to do is draw the graph on the Axes generated by ʻadd_subplot`.
fig = plt.figure()
ax = fig.add_subplot(111)

ax.hist([1, 2, 3])
fig.show()
It looks like this when drawing a rough graph with a stop of thinking.
Reference I refer to this article. Basics of matplotlib drawing-for those who don't understand figs and axes
Recommended Posts