[PYTHON] Candlestick chart and moving average plot
Good morning. It's finally spring-like season. Today, I will talk about stock prices a little more, following the last time. In the previous talk, I touched on the formula for calculating the ideal stock price and the moving average line in the discussion of how to analyze. If you have forgotten, please read the second half of the previous article again.
First aside
By the way, the story is a digression, but last week, the turmoil over the famous social game "Puzzle & Dragons" became a big deal.
Puzzle & Dragons is a popular game with over 30 million downloads, and it appears after that Comp Gacha Uproar, even for free. As a fun specification, the billing amount was kept low and it became popular GungHo Bubble occurred, and it is just like a representative of the new social game era. I'm sure there aren't any.
However, after that, the bubble burst Recently, it seems that one Pazudora is very struggling. However, last week, in that Pazudora, a new character in collaboration with Square Enix "Amusement artist" is too strong It was a big fuss. That's all topic on social media, etc., and the topic that the character of the game is too strong is [on the top news of Yahoo!]( http://dic.nicovideo.jp/a/%E6%9B%B2%E8%8A%B8%E5%A3%AB%28%E3%83%91%E3%82%BA%E3%83%89 % E3% 83% A9% 29), so I think you all know it.
Social games are always inflated, and everyone has known this for a long time. Because if people invest money and time, everyone will become stronger, and in order to allow newcomers who entered later to overtake those who became stronger first, we will introduce more rare items and so on. There is no choice but to inflate. It's a promised pattern in the quiz show, "Yes, then the score will increase 10 times from the next question!" This kind of thing is the norm in online games whatever you do now even if you are aware of the problem.
However, when inflation suddenly occurs like this time, we will be repulsed by what the results of the people who have charged so far have been, and the service life will only end when inflation accelerates, so the life of the game will be extended. Shrink. This time, it seems that the person in charge of Square Enix on the collaboration side decided the parameters The person in charge of Square Enix burns It became a fuss. .. This kind of game is a world where people's money is on a delicate balance, so once you make a mistake in adjusting the balance, the system can collapse immediately.
Speaking of Square Enix, it used to be a company that produced home video games such as FF (Final Fantasy) and DQ (Dragon Quest), but recently, "Diffusive Million Arthur .jp / smart / ma /) ”entered the social game industry, and now I want to increase sales from 10 billion yen to 40 billion yen It seems that we will put effort into it. Kaku-San-Sei Million Arthur, which is such a signboard title, also announced that it will end suddenly at the end of last year (http://nlab.itmedia.co.jp/nl/articles/1412/26/news112.html). All services will end at the end of the month. Moreover, the main reason for this is the lack of core human resources. Even if the title is on the rise, it is possible that the service will end due to a sudden decline in popularity due to minor factors such as the outflow of human resources and imbalance adjustment. What an unstable and rapidly changing industry!
As you can see, the prices of social game-related stocks are extremely volatile, and it is a world where trends rise and fall overnight and trends change extremely rapidly. The situation is different from general enterprise industries such as the manufacturing industry, which are relatively faithful to the Nikkei Stock Average, and because of the high risk, they are not suitable for long-term holding of stocks. I can't recommend it to anyone other than those who can trace the charts every day while following the circumstances in and around the game. In this series, we have recently published a story about stocks on the Internet in a form that can be viewed by an unspecified number of people, but in the first place, we will definitely stop doing careless actions such as touching stocks based on fragmentary information on the Internet. Please give me. With that level of insight and analytical ability, it is not possible to reach out to stocks and secure stable yields. It's just gambling, such as stocks without theory. Of course, I cannot take any responsibility even if I suffer a loss and see a pain. Even if you happen to make a temporary profit from gambling, it is not your ability as an investor.
The first step in technical analysis
By the way, as I wrote above, technical analysis is indispensable to prevent the situation of being at the mercy of Internet rumors, to scientifically analyze the numerical values of economic indicators with your own eyes, and to make a proper judgment. .. This applies not only to stocks, but also to various business analyzes. Science is the basis of human civilization, and it is overwhelmingly disadvantageous in competition when numerical calculations are not performed in the era of computer development. The times are different from 20 years ago when computers were not so popular. However, I am not saying that you should make full use of advanced mathematics. It doesn't matter if you have enough math skills that even high school students can do. Of course, not only technical analysis but also fundamental analysis is important, but I will talk about that later.
As a first step, let's calculate the ideal stock price from PER.
Calculate the ideal stock price based on PER
Do you have a proper annual health checkup? Even humans should be able to obtain a certain ideal weight once their height is determined. When you look at the results of your health checkup, it says "slightly thin" or "overweight", and every time you see it, you may be overwhelmed. In the same way, there is an ideal stock price for stock prices. Last time, I introduced a formula to simply calculate the PER ideal stock price. I will post it again.
Theoretical stock price= \frac {Expected annual net income} {Number of issued shares x PER}
Of the above formulas, the number of issued shares and PER can be obtained from sites such as Yahoo! Finance. You can also get the closing price of the previous day in the same way. Now, the point here is the expected annual net income. As of February at the time of writing, net income has not been finalized at this point, so we estimate the expected annual net income based on the IR information of each company. Here, I tried to calculate after extracting the numerical values set by each company as they are from the third quarter financial report and the explanatory materials for shareholders. This is a simple calculation, so let's try it with spreadsheet software (LibreOffice).

Here are some similar companies in the same industry as our company (DTS). We are currently applying the closing price of last weekend to the stock price. How about, I think that almost every company has such a number. In fact, almost all of the companies listed above posted higher sales and profits in the third quarter. And when you actually look at the stock price, it can be confirmed that the number is reflected, or it is very slightly expensive. Note that this is a simple calculation based on PER (Price Earnings Ratio), so it cannot be taken as it is. However, first of all, you can see that it can be used as a guide as to whether the current stock price is overpriced or undervalued. Using this as a reference, please try to calculate the ideal stock price from the PER of the company of interest.
Calculate and plot the moving average
Now I know the stock price guide. Next, it is important to find the trend price flow from the chart. Again, technical indicators should be used rather than human sensory judgment. The simplest and most useful indicators for this are the trend line and the moving average.
Trend line
The trend line is a line that draws a chart that draws two points, the low price and the low price, to form a support line in the rising market, and a resistance line by connecting the two points, the high price and the high price, in the falling market. It's a very simple but basic analysis that even professional traders love. If you can draw the trend line correctly, you can visually grasp how the exchange rate moves, and you can grasp the trading points such as the target value of profit taking and the stop loss.
The trend line is a basic and simple of the basics, but it is a profound index that is said to draw a completely different line between amateurs and professionals. In this way, it is difficult to read properly because there are some parts where personality cannot be eliminated.
Moving average
Although the moving average line is also a simple calculation method, it is a very useful trend-based technical index in that it makes the trend clear at a glance and grasps the points of buying and selling.
Last time Let's calculate the moving average line explained. I put the formula last time, but for example, a simple average can be calculated by a 5-day moving average (addition of closing prices for 5 days / 5 days). It's easy.
Born in the field of finance, pandas should be used for rich and sophisticated time series analysis functions, R-like data frames, and numerous statistics and data analysis. Functions are implemented. Moving averages can also be easily calculated and visualized using pandas. You can also use the pandas function to find the Exponential Weighted Moving Average, which is a bit more complicated to calculate. This area is truly.
The following example finds the moving average for the adjusted closing price.
#Find SMA5 and SMA25
sma25 = pd.rolling_mean(stock_tse['Adj Close'], window=25)
sma5 = pd.rolling_mean(stock_tse['Adj Close'], window=5)
sma25.plot(label="SMA25") #Plot
sma5.plot(label="SMA5")

ewma = pd.stats.moments.ewma
#Ask for EWMA5 and EWMA25
ewma25 = ewma(stock_tse['Adj Close'], span=25)
ewma5 = ewma(stock_tse['Adj Close'], span=5)
ewma25.plot(label="EWMA25") #Plot
ewma5.plot(label="EWMA5")

plt.legend(loc="best") #Show label for each line
Let's overlay the moving average on the GungHo and Square Enix candlestick charts mentioned at the beginning. Both are as of the closing price last weekend.
GungHo
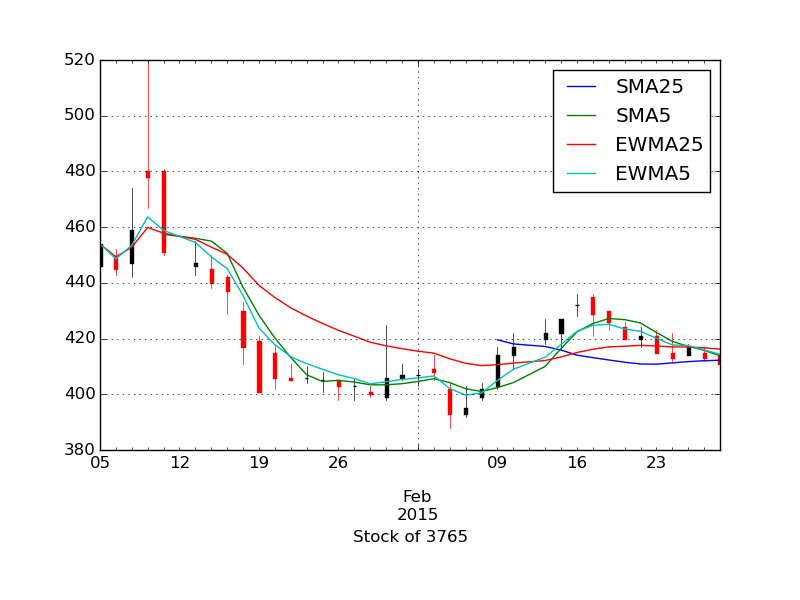
Square Enix

It has become a little like that chart.
It is generally said that the short-term trend is the 25-day moving average and the long-term trend is the 75-day moving average. In addition, the index-weighted moving average reacts faster to market movements than the simple moving average, allowing you to detect trend changes earlier. However, please note that the amount of damage will increase accordingly.
Summary
This time, I gave examples of several companies and gave examples of stock market analysis as part of the economic analysis. If you perform technical analysis on actual data, you will be able to grasp live data, which will give you a real feeling, so it may be worthwhile.
As I will reiterate, the author cannot take any responsibility even if the stock is actually touched based on the contents of these series. Please use it as a reference only, and be sure to perform the actual analysis by yourself. Also, please refrain from investing in stocks due to hearsay or courage as it may cause injuries.
Recommended Posts