[Qiita API] Get Views, Likes, Stocks by various methods (JavaScript, Google Script, Python, Vue.js)
Introduction
Looking at my post on Qiita, there are three numbers: "Page View", "Like", and "Stock". The "Like Count" of all posts is totaled on My Page, but the View, Stock, and total of each post are not clear. Since the number of posts has reached about 20, I decided to try various methods to get all of View, Like, and Stock of my posts for studying.
When I looked it up, everyone hit the Qiita API in various ways to get information, and there are many reference pages, so I will carry out while checking them.
-"Like": You can get it by hitting the API (likes_count) -"Pageview (View)": You can get it by setting the access token and hitting the API (page_views_count) -"Stock": The number cannot be obtained by API, so count the number of users in stock.
Reference URL
I mainly referred to the following posts. (Other reference pages are listed at the end) [Qiita API] Like! Automatic counting of views (Qiita)
Premise
Issuance of Qiita personal access token Qiita "Settings"-> "Applications"-> "Personal access token" (read-only: read_qiita)
Implementation type
①HTML/JavaScript ②GoogleScript ③Python + Vue.js
①HTML/JavaScript
・ Set your own access token and press the "Read" button.


code
<!DOCTYPE html>
<html lang="ja">
  <head>
    <meta charset="utf-8">
    <title>Qiita Item Get</title>
    <link rel="stylesheet" href="https://stackpath.bootstrapcdn.com/bootstrap/4.1.3/css/bootstrap.min.css">
  </head>

  <body>
    <div class="container">
      <br>
 <h3> Get Qiita post list </ h3>
      <br>
      <div class="input-group flex-nowrap">
        <div class="input-group-prepend">
 <span class = "input-group-text" id = "addon-wrapping"> Qiita access token settings </ span>
        </div>
        <input type="text" class="form-control" id="accesstoken" placeholder="Access Token" aria-describedby="addon-wrapping">
      </div>
      <br>
 <button type = "button" class = "btn btn-primary" onclick = "getData ()"> Read </ button>
      <hr>
      <div id="result"></div>
    </div>

    <script src="https://code.jquery.com/jquery-3.2.1.min.js" integrity="sha256-hwg4gsxgFZhOsEEamdOYGBf13FyQuiTwlAQgxVSNgt4=" crossorigin="anonymous"></script>

    <script>
      var title;
      var view;
      var like;
      var stock;

      function getData() {
 // Confirm access token
        var token = document.getElementById('accesstoken').value
        if(token == ''){
 alert ('Please enter an access token')
          return
        }

 // Display until you can get it
        var result = $("#result");
        var loading = '<p>Now Loading...</p>';
        result.append(loading);

 // Get your own post list and get the data by id
        var items = [];
        $.ajax({
          type: "GET",
          url: "https://qiita.com/api/v2/authenticated_user/items",
          headers: {
            "Content-Type": "application/json",
            "Authorization": "Bearer " + token,
          },
          dataType: "json",
          success: function(data){
            items = data;

            var sum_view = 0;
            var sum_like = 0;
            var sum_stock = 0;

            var html = '<table class="table table-dark">' +
 '<thead> <tr> <th scope = "col"> No </ th> <th scope = "col"> Title </ th> <th scope = "col"> VIEWS </ th> <th scope = "col"> LIKES </ th> <th scope = "col"> STOCKS </ th> <th scope = "col"> LIKE rate </ th> <th scope = "col"> STOCK rate </ th> </ tr> </ head> <tbody>'

 // Loop the post list, get the data by ID, set the HTML
            for (var i = 0; i < items.length; i++) {
              qiitaView(items[i].id, token);
              qiitaStock(items[i].id, token);

              var no = items.length - i;

              var per_like = like / view * 1000;
              var math_like = Math.round(per_like) / 1000;

              var per_stock = stock / view * 1000;
              var math_stock = Math.round(per_stock) / 1000;

              html +=
              '<tr>' +
              '<th scope="row">' + no + '</th>' +
              '<td><a href="' + url + '" target="_blank">' + title + '</a></td>' +
              '<td>' + view + '</td>' +
              '<td>' + like + '</td>' +
              '<td>' + stock + '</td>' +
              '<td>' + math_like + '</td>' +
              '<td>' + math_stock + '</td>' +
              '</tr>';

              sum_view += view;
              sum_like += like;
              sum_stock += stock;

            };

 // Set the total in html and export
            html +=
              '<tr>' +
 '<th scope = "row"> total </ th>'+
              '<td></td>' +
              '<td>' + sum_view + '</td>' +
              '<td>' + sum_like + '</td>' +
              '<td>' + sum_stock + '</td>' +
              '<td>' + '' + '</td>' +
              '<td>' + '' + '</td>' +
              '</tr>' +
              '</tbody></table>';

            result.empty();
            result.append(html);

          },
          error: function(XMLHttpRequest, textStatus, errorThrown){
            result.empty();
 alert ('Error1: Do you have an access token?' + ErrorThrown);
          }
        });

      };

      function qiitaView(id, token) {

        var views = [];

        $.ajax({
          type: "GET",
          url: 'https://qiita.com/api/v2/items/' + id,
          headers: {
            "Content-Type": "application/json",
            "Authorization": "Bearer " + token,
          },
          dataType: "json",
 async: false, // Synchronous communication
          success: function(data){
            views = data;
            title = views.title;
            url = views.url;
            like = views.likes_count;
            view = views.page_views_count;
          },
          error: function(XMLHttpRequest, textStatus, errorThrown){
            alert('Error2 : ' + errorThrown);
          }
        });

      };

      function qiitaStock(id, token) {

        var stocks = [];
        var flg = 'off';

        for (var j = 1; j < 4; j++) {

          $.ajax({
            type: "GET",
            url: 'https://qiita.com/api/v2/items/' + id + '/stockers?page=' + j + '&per_page=100',
            headers: {
              "Content-Type": "application/json",
              "Authorization": "Bearer " + token,
            },
            dataType: "json",
 async: false, // Synchronous communication
            success: function(data){
              stocks = data;
              var stock_len = stocks.length;

              if (stock_len != 100) {
                stock = (j * 100) - 100 + stock_len;
                flg = 'on';
              }

            },
            error: function(XMLHttpRequest, textStatus, errorThrown){
              alert('Error3 : ' + errorThrown);
            }
          });

          if (flg=='on') {
            break;
          }

        };
      };
    </script>
  </body>
</html>
②Google Script -Create a GS script and set the project to be executed periodically. (Set from "Edit"-> "Trigger of current project". Set to get once a day) (The google script is almost on the page that I referred to. I set the rate for stock and view additionally) (Stock is acquired up to 1000 stock for each post)
If you get it every day, you can see that there are about 50 to 100 views.


code
function myFunction() {
// Variable setting
var sum_likes = 0
var sum_page_views = 0
var sum_stocks = 0
// Acquisition date setting
var now = new Date()
var record_title = ['date']
var record_page_views = [now]
var record_likes = [now]
var record_stocks = [now]
// Get your own post via Qiita API
var url = 'https://qiita.com/api/v2/authenticated_user/items'
var option = {
headers : {
'Authorization':'Set Bearer Access Token'
},
method : 'get'
}
var res = UrlFetchApp.fetch(url, option)
var list = JSON.parse(res.getContentText())
list = list.reverse () // Change from descending order to ascending order
// Loop through the retrieved items to get the view, like, stock
for(var i = 0; i < list.length; i++) {
var item = list[i]
// Get the number of likes
var item_id = item['id']
var title = item['title']
var likes_count = item['likes_count']
sum_likes += likes_count
// get page view
url = 'https://qiita.com/api/v2/items/' + item_id
res = UrlFetchApp.fetch(url, option)
var json = JSON.parse(res.getContentText())
var page_views_count = json['page_views_count']
sum_page_views += page_views_count
// Get the number of stocks
var cnt = 1
var stock_count = 0
while(cnt < 10) {
var url_stock = url + '/stockers?page=' + cnt + '&per_page=100'
var res_stock = UrlFetchApp.fetch(url_stock, option)
var json_stock = JSON.parse(res_stock.getContentText())
var stock_num = json_stock.length
if (stock_num != 100) {
stock_count = (cnt * 100) - 100 + stock_num
sum_stocks += stock_count
break
} else {
cnt += 1
}
}
// Set data for sheet export
record_title.push(title)
record_page_views.push(page_views_count)
record_likes.push(likes_count)
record_stocks.push(stock_count)
}
// Calculate rate
var par_likes = sum_likes / sum_page_views
var par_stocks = sum_stocks / sum_page_views
// Spreadsheet set
var spreadsheet = SpreadsheetApp.openById('xxxxxxxxxxxxxxxxxxxxxxxxxxx')
// Sheet: sum
var sheet = spreadsheet.getSheetByName('sum')
sheet.appendRow([new Date(), list.length, sum_page_views, sum_likes, sum_stocks, par_likes, par_stocks])
// Sheet: view
var sheet = spreadsheet.getSheetByName('view')
sheet.getRange('1:1').clear()
sheet.getRange(1,1,1,record_title.length).setValues([record_title])
sheet.appendRow(record_page_views)
// Sheet: like
var sheet = spreadsheet.getSheetByName('like')
sheet.getRange('1:1').clear()
sheet.getRange(1,1,1,record_title.length).setValues([record_title])
sheet.appendRow(record_likes)
// Sheet: stock
var sheet = spreadsheet.getSheetByName('stock')
sheet.getRange('1:1').clear()
sheet.getRange(1,1,1,record_title.length).setValues([record_title])
sheet.appendRow(record_stocks)
}
```
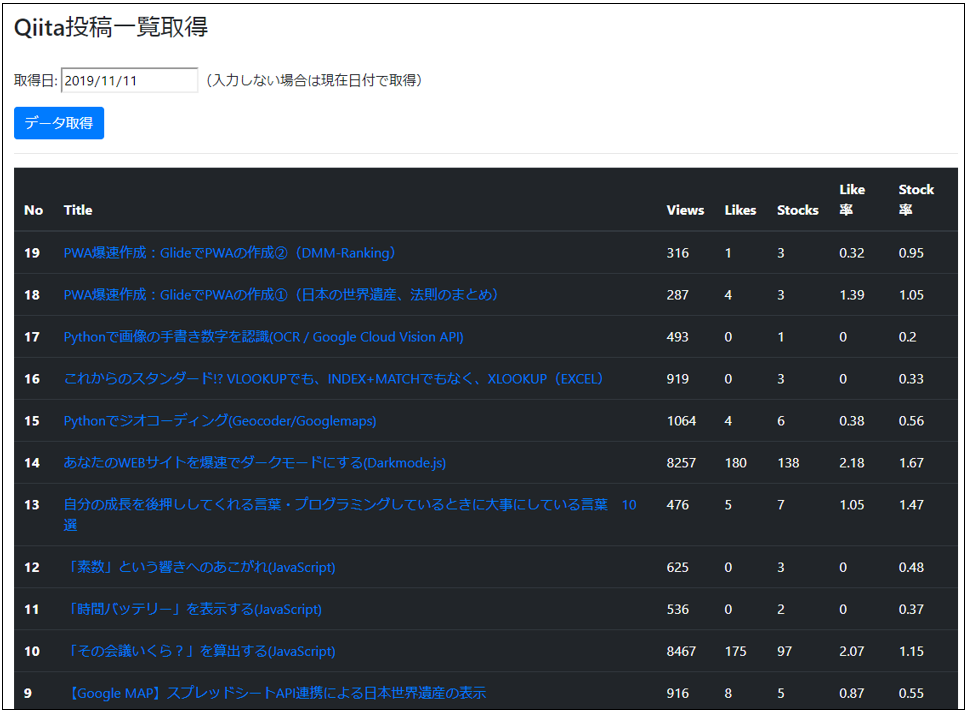
##③Python + PHP/Vue.js
-Get the data with Qiita API and set it in DB (Python is executed once a day with Cron setting)
- Vue.Get DB information by hitting axios with js(php),display
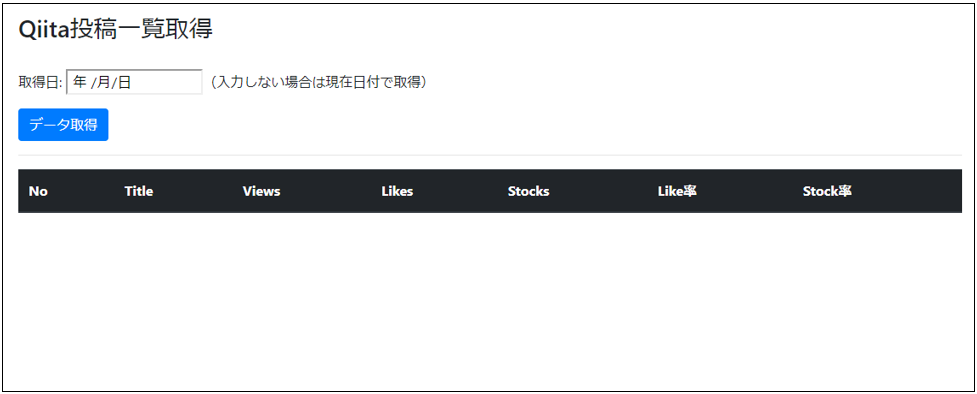
-Press the data acquisition button
-Get Python data with Qiita API and set it in DB (execute once a day with Cron setting)
~~~Qiita_data_get.py
import requests
import json
import datetime
import MySQLdb
#Qiita access token
token = 'xxxxxxxxxxxxxxxxxxxxxxxxxxxxxxxxxxxxxxxxxxxx'
#Qiita API settings
url = 'https://qiita.com/api/v2/authenticated_user/items'
headers = {'content-type': 'application/json',
'Authorization': 'Bearer ' + token}
#Connection information settings
cnt = MySQLdb.connect(
user='xxxxxxxxxxxx',
passwd='xxxxxxxxxxxxx',
host='xxxxxxxxxxxxxxxxxxxx',
db='xxxxxxxxxxxxxx',
charset='utf8'
)
#Get cursor
db = cnt.cursor()
#Data acquisition / sorting
res = requests.get(url, headers=headers)
list = res.json()
for item in list:
item_id = item['id']
#Title, set of like numbers
title = item['title']
item_url = item['url']
likes_count = item['likes_count']
url = 'https://qiita.com/api/v2/items/' + item_id
res = requests.get(url, headers=headers)
json = res.json()
#Set of number of views by title
page_views_count = json['page_views_count']
i = 1
#Get the number of stocks
while i < 10:
url_stock = url + '/stockers?page=' + str(i) + '&per_page=100'
res_stock = requests.get(url_stock, headers=headers)
json_stock = res_stock.json()
stock_num = len(json_stock)
if stock_num != 100:
stock_count = (i * 100) - 100 + stock_num
break
else:
i += 1
#Date setting
now = datetime.datetime.now()
setdate = now.strftime('%Y-%m-%d')
# like,Calculate percentage of stock
per_like = likes_count / page_views_count * 100
per_like = round(per_like, 2)
per_stock = stock_count / page_views_count * 100
per_stock = round(per_stock, 2)
#Select DB data by date and title
sqlselect = "SELECT * from qiita_data WHERE setdate='" + setdate + "' AND title='" + title + "'"
db.execute(sqlselect)
row = db.fetchall()
dbcnt = len(row)
#Update if there is data in the DB(If you run it on the same day, it will overwrite the data)
if dbcnt > 0:
sqlupdate = "UPDATE qiita_data SET views='" + str(page_views_count) + "', likes='" + str(likes_count) + "', stocks='" + str(stock_count) + "', per_like='" + str(per_like) + "', per_stock='" + str(per_stock) + "' WHERE setdate='" + setdate + "' AND title='" + title + "'"
db.execute(sqlupdate)
#Insert if there is no data in DB
else:
sqlinsert = "INSERT INTO qiita_data(setdate, title, url, views, likes, stocks, per_like, per_stock) VALUES ('" + setdate + "', '" + title + "', '" + item_url + "', '" + str(page_views_count) + "', '" + str(likes_count) + "', '" + str(stock_count) + "', '" + str(per_like) + "', '" + str(per_stock) + "')"
db.execute(sqlinsert)
#Cursor end
db.close()
#commit
cnt.commit()
#MySQL disconnect
cnt.close()
-Returns DB information
<?php

  //Set of DB settings
  $host = "xxxxxxxxxxxxxxxxxxxxxxxx";
  $dbname = "xxxxxxxxxxxxxxxxxxxxxxx";
  $user = "xxxxxxxxxxxxx";
  $pass = "xxxxxxxxxxxxx";

  //Get parameters
  if (!isset($_GET['setdate'])) {
    $paramdate = '19000101';
  } else {
    $paramdate = $_GET['setdate'];
  }

  //Check the number of digits
  if (strlen($paramdate)!=8) {
    http_response_code(500);
    echo "setdate length is not 8";
    exit();
  }

  //YYYYMMDD format check
  $stryear  = substr($paramdate, 0, 4);
  $strmonth = substr($paramdate, 4, 2);
  $strday   = substr($paramdate, 6, 2);
  if (!checkdate($strmonth, $strday, $stryear)) {
    http_response_code(500);
    echo "setdate is not date";
    exit();
  }

  //Header information settings
  header("Content-Type: application/json; charset=utf-8");

  $data = array();

  //DB connection information setting / SQL preparation / connection
  $db = new PDO('mysql:host=' . $host . 'dbname=' . $dbname . 'charset=utf8', $user, $pass);

  //If the date does not come
  if ($paramdate == '19000101') {
    $sql = "select * from qiita_data";
  //When the date is set in the parameter
  } else {
    $sql = "select * from qiita_data where setdate='" . $paramdate . "'";
  }
  $sth = $db -> prepare($sql);
  $sth -> execute();

  //Get the data
  $data = $sth -> fetchAll(PDO::FETCH_ASSOC);

  //json objectization
  echo json_encode($data);
?>
- Vues.Display with js
<!DOCTYPE html>
<html lang="ja">
  <head>
    <meta charset="utf-8">
    <title>Qiita Data Get</title>
    <link rel="stylesheet" href="https://stackpath.bootstrapcdn.com/bootstrap/4.1.3/css/bootstrap.min.css">
  </head>

  <body>
    <div class="container">
      <div id="app">
        <br>
        <h3>Get Qiita post list</h3>
        <br>
        <p>Date of acquisition: <input type="date" id="date" v-model="getdate">(If you do not enter it, get it with the current date)</p>
        <button type="button" class="btn btn-primary" v-on:click="getitem">Data acquisition</button>
        <hr>
        <table class="table table-dark">
          <thead>
            <tr>
              <th scope="col">No</th>
              <th scope="col">Title</th>
              <th scope="col">Views</th>
              <th scope="col">Likes</th>
              <th scope="col">Stocks</th>
              <th scope="col">Like rate</th>
              <th scope="col">Stock rate</th>
            </tr>
          </thead>
          <tr v-for="(item, index) in items" :key="item.no">
            <th scope="row">{{ itemno - index }}</th>
            <td><a v-bind:href="item.url" target="_blank">{{ item.title }}</a></td>
            <td>{{ item.views }}</td>
            <td>{{ item.likes }}</td>
            <td>{{ item.stocks }}</td>
            <td>{{ item.per_like }}</td>
            <td>{{ item.per_stock }}</td>
          </tr>
        </table>
      </div>
    <div>

    <script src="https://cdn.jsdelivr.net/npm/vue/dist/vue.js"></script>
    <script src="https://unpkg.com/axios/dist/axios.min.js"></script>

    <script>
      var app = new Vue({
        el: '#app',
        data: {
          items: [],
          getdate: '',
          itemno: 0
        },
        methods: {
          getitem() {

            if( this.getdate === ''){
              var date = new Date();
              var yyyy = date.getFullYear();
              var mm = ("0"+(date.getMonth()+1)).slice(-2);
              var dd = ("0"+date.getDate()).slice(-2);
              this.getdate = yyyy+'-'+mm+'-'+dd;
            }

            yyyy = this.getdate.substr(0,4)
            mm = this.getdate.substr(5,2)
            dd = this.getdate.substr(8,2)
            var setdate = yyyy + mm + dd
            var url = 'xxxxxxxxxxxxxxxxxxxxxxxxxxxxxxxxx/qiita_data_get.php?setdate=' + setdate

            axios.get(url)
            .then(function(response){
              this.items = response.data
              this.itemno = this.items.length
              if(this.itemno == 0){
                alert('Data could not be obtained')
              }
              console.log(this.itemno)
            }.bind(this))
            .catch(function(error){
              console.log(error + 'Is happening')
            })
          }
        }
      })
    </script>
  </body>
</html>
##Summary ・ Hit QiitaAPI to "page view" of your post/"How nice"/Implemented the place to acquire and display all the information of "stock". ・ I think any method can be used, but I thought it would be convenient because Google Script can easily set regular execution. ・ Next, I would like to try a graph display that shows the accumulated information in a nice way. → 2020/02/12 Addendum:Chart.Use js to display a multi-axis graph(Javascript)It was carried out at.
##Other reference URLs
- Qiita API v2 documentation
- Overview of Qiita API v2(informal)
- Summary of reference articles when utilizing Qiita API v2
- Vue.js +Hit Qiita API v2 on axios to get posts
Recommended Posts