[PYTHON] Data set for evaluation of spam reviewer detection algorithm
Overview
 For evaluation of spam reviewer detection algorithms,
Paper [A Bipartite Graph Model and Mutually Reinforcing Analysis for Review Sites](http://www.anrdoezrs.net/links/8186671/type/dlg/http://link.springer.com/chapter/10.1007%2F978-3 -642-23088-2_25)
Artificial data has been published. This article summarizes how to use it.
It also summarizes parallel evaluation using Google Cloud Platform.
For evaluation of spam reviewer detection algorithms,
Paper [A Bipartite Graph Model and Mutually Reinforcing Analysis for Review Sites](http://www.anrdoezrs.net/links/8186671/type/dlg/http://link.springer.com/chapter/10.1007%2F978-3 -642-23088-2_25)
Artificial data has been published. This article summarizes how to use it.
It also summarizes parallel evaluation using Google Cloud Platform.
Installation
The package is registered in PyPI, so you can install it with the pip command.
$ pip install --upgrade rgmining-synthetic-dataset
Reading artificial graph data
The rgmining-synthetic-dataset contains the synthetic package,
Export the synthetic.load function and the synthetic.ANOMALOUS_REVIEWER_SIZE constant.
The synthetic.load function loads the artificial review graph data and
The synthetic.ANOMALOUS_REVIEWER_SIZE constant is included in this dataset
It represents the number of peculiar spam reviewers (57).
Unique spam reviewers have ʻanomaly` in their names.
Therefore, in the evaluation using this data set,
How accurate and reproducible can you find 57 spam reviewers? To find out.
I will omit the explanation of how the artificial data was created. If you are interested, [Original paper](http://www.anrdoezrs.net/links/8186671/type/dlg/http://link.springer.com/chapter/10.1007%2F978-3-642-23088- Please refer to 2_25). (I may summarize it in another article someday)
The synthetic.load function takes a graph object as an argument.
This graph object is
--new_reviewer (name): Creates and returns a reviewer object with the name name.
--new_product (name): Creates and returns a product object with the name name.
--ʻAdd_review (reviewer, product, rating) : Add a review with a score of ratingtoproduct by reviewer. Note that. It is assumed that rating` is normalized to 0 or more and 1 or less.
You need to have three methods.
The Fraud Eagle introduced the other day meets this condition. Therefore,
import fraud_eagle as feagle
import synthetic

graph = feagle.ReviewGraph(0.10)
synthetic.load(graph)
If so, the Fraud Eagle algorithm can be used to analyze this artificial data.
Actual analysis
Fraud Eagle was an algorithm that takes one parameter, so Let's find out which parameters are suitable for this artificial dataset. This time, out of the top 57 people with a high ʻanomalous_score`, Evaluate using the percentage that was actually a peculiar spam reviewer. (The higher this ratio, the more correct and peculiar spam reviewers can be found.)
analyze.py
#!/usr/bin/env python
import click
import fraud_eagle as feagle
import synthetic

@click.command()
@click.argument("epsilon", type=float)
def analyze(epsilon):
    graph = feagle.ReviewGraph(epsilon)
    synthetic.load(graph)

    for _ in range(100):
        diff = graph.update()
        print("Iteration end: {0}".format(diff))
        if diff < 10**-4:
            break

    reviewers = sorted(
        graph.reviewers,
        key=lambda r: -r.anomalous_score)[:synthetic.ANOMALOUS_REVIEWER_SIZE]

    print(len([r for r in reviewers if "anomaly" in r.name]) / len(reviewers))

if __name__ == "__main__":
    analyze()
I used click for the command line parser.
$ chmod u+x analyze.py
$ ./analyze.py 0.1
Then, you can experiment with the parameter as 0.1. The output is
$ ./analyze.py 0.10
Iteration end: 0.388863491546
Iteration end: 0.486597792445
Iteration end: 0.679722652169
Iteration end: 0.546349261422
Iteration end: 0.333657951459
Iteration end: 0.143313076183
Iteration end: 0.0596751050403
Iteration end: 0.0265415183341
Iteration end: 0.0109979501706
Iteration end: 0.00584731865022
Iteration end: 0.00256288275348
Iteration end: 0.00102187920468
Iteration end: 0.000365458293609
Iteration end: 0.000151984909839
Iteration end: 4.14654814812e-05
0.543859649123
It seems that about 54% of the top 57 people were unique spam reviewers.
Investigating optimal parameters in the cloud
I set the parameter to 0.1 earlier, but does the result change with other values? Let's check for multiple values. Basically, you can execute the above script one by one with different parameters. Since it seems to take time, we will execute it in parallel using Google's cloud.
To use Google Cloud, use the tool roadie introduced in Using Google Cloud Platform more easily. Please refer to the above article for the installation and initial setting method.
First, list the libraries required to execute the analyze.py created earlier in requirements.txt.
requirements.txt
click==6.6
rgmining-fraud-eagle==0.9.0
rgmining-synthetic-dataset==0.9.0
Then, create a script file for executing roadie.
analyze.yml
run:
- python analyze.py {{epsilon}}
This time, we don't need external data files or apt packages, so
Simply write only the run command. The {{epsilon}} part is a placeholder,
Pass it as an argument when creating an instance.
Also, since we plan to create many instances this time, we will use queues.
First of all, execute the first task, which also serves as uploading the source code.
$ roadie run --local . --name feagle0.01 --queue feagle -e epsilon=0.01 analyze.yml
The first is to set the parameter to 0.01.
With -e epsilon = 0.05, the value is set to{{epsilon}}in analyze.yml.
Then run the task for the remaining parameters.
$ for i in `seq -w 2 25`; do
  roadie run --source "feagle0.01.tar.gz" --name "feagle0.${i}" \
    --queue feagle -e "epsilon=0.$i" analyze.yml
done
—source feagle0.01.tar.gz specifies the use of the source code uploaded first.
Also, if you pass —queue <name> to the roadie run command like this,
We will add tasks to the queue called <name>. (Reference)
By default, one instance is processing the queue, so
If you want to execute in parallel, you need to start the instance.
This time, I will try to execute it with a total of about 8 units for the time being.
One is already running, so let's start the remaining seven.
$ roadie queue instance add --instances 7 feagle
The execution status of each instance is
$ roadie status
You can check with. The name of the queue + a random number is the name of the instance processing the queue. If the status disappears, the process is complete.
Since the execution result is saved in Google Cloud Storage, Get it with the following command and write it to a CSV file.
$ for i in `seq -w 1 25`; do
  echo "0.${i}, `roadie result show feagle0.${i} | tail -1`" >> result.csv
done
You can get the output of each task with roadie result show <task name>.
Let's plot the obtained CSV.
plot.py
#!/usr/bin/env python
import click
from matplotlib import pyplot
import pandas as pd

@click.command()
@click.argument("infile")
def plot(infile):
    data = pd.read_csv(infile, header=None)
    pyplot.plot(data[0], data[1])
    pyplot.show()

if __name__ == "__main__":
    plot()
It's pretty simple, but it's a good prototype.
$ chmod u+x plot.py
$ ./plot.py result.csv
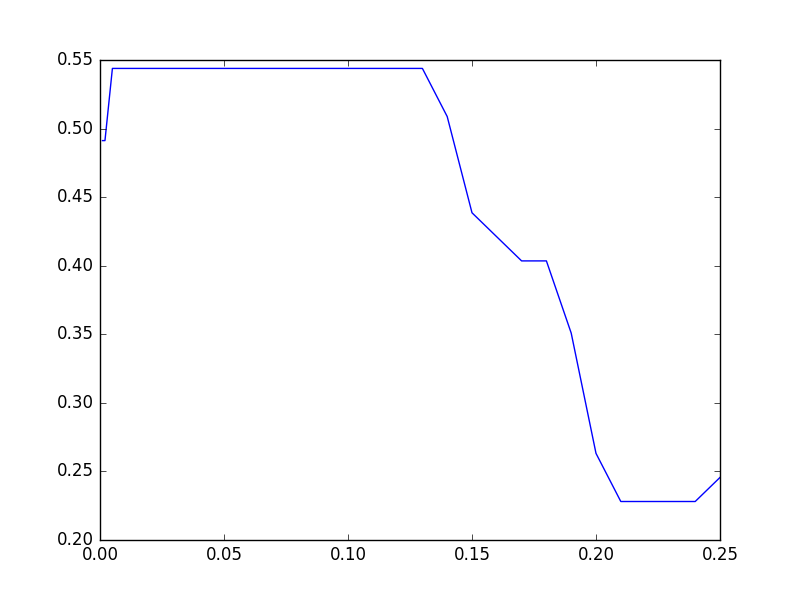
The result at hand is as follows.

Since 0.01 to 0.13 are flat, let's check even a slightly smaller value. Put the task in the queue as before and execute it in 8 parallels.
$ for i in `seq -w 1 9`; do
  roadie run --source "feagle0.01.tar.gz" --name "feagle0.00${i}" \
    --queue feagle -e "epsilon=0.00$i" analyze.yml
done
$ roadie queue instance add --instances 7 feagle
When the execution is finished, create a CSV and plot it as shown below.
$ for i in `seq -w 1 9`; do
    echo “0.00${i}, `roadie result show feagle0.00${i} | tail -1`" >> result2.csv
done
$ for i in `seq -w 1 25`; do
    echo "0.${i}, `roadie result show feagle0.${i} | tail -1`" >> result2.csv
done
$ ./plot.py result2.csv
The result is as follows. About 54% seems to be the best in Fraud Eagle.
By the way, in fact, the algorithm does not converge and oscillates when the parameter is around 0.01.
For example, in the case of 0.01, the output is
Iteration end: 0.97009695897
Iteration end: 0.97009695897
Iteration end: 0.97009695897
Iteration end: 0.97009695897
Iteration end: 0.97009695897
Iteration end: 0.97009695897
Iteration end: 0.97009695897
Iteration end: 0.97009695897
Iteration end: 0.97009695897
It looks like this. This time, it is cut off in 100 loops. I feel that the original paper did not talk about convergence conditions, so It seems that we need to investigate a little more.
Recommended Posts