[PYTHON] Let's set up a survival prediction model for Titanic passengers
Introduction
This article is an article on ** 24th day ** of Gizumo Engineer Advent Calendar 2015.
I'm @suzumi, a web application engineer at Gizumo Co., Ltd., a young company that has been around for half a year. This is the second article on the Advent calendar. The first article is "IoT-I tried to remotely control the air conditioner from the Web using node.js". Please see together if you like.
theme
First of all, let's get acquainted with Kaggle.
What is Kaggle?
Kaggle is a predictive modeling and analytical method related platform and its operating company where companies and researchers post data and statisticians and data analysts around the world compete for the optimal model. --From WikiPedia
As you can see in the quote, it is a site where companies etc. post data, analyze and model it, and compete for optimal modeling. For companies that post data and hold competitions, it can be used for recruiting excellent data scientists. Those who participate in the competition have become a platform that has merits on both sides, such as trying to improve their own abilities and studying. In addition, some competitions will give out prize money, and some competitions will give out prize money of 3 million dollars (350 million yen). User Ranking is also open to the public, and if it is listed here, it will attract attention from all over the world as an excellent data scientist. Just as the number of stars on GitHub is the status, I think the ranking will be the status for data scientists.
Recruit decides to hold "RECRUIT Challenge --Coupon Purchase Prediction", the first data prediction competition co-sponsored by Japanese companies with "Kaggle" It became a hot topic in the news in the summer, and I think that Kaggle's popularity has increased dramatically in Japan as well. I also learned about Kaggle from this news (Tehe)
Recently, when I walked, I could hear words such as "data science", "machine learning", and "artificial intelligence" everywhere. Of course, I can't keep silent because I like fashionable things.
So, this time, I would like to try Kaggle's tutorial-like competition, "Titanic's Survival Prediction".
By the way, the execution environment is as follows. It was troublesome to put in various numerical calculation libraries, so I put in Anaconda.
- Python3.5
- iPython notebook
Data preparation
First, let's prepare the data. First, jump to the Competition Page. Download the data from "data" on the dashboard on the left. I'm not sure for the time being, so I will download the following csv that looks like it.
- train.csv (59.76 kb)
- test.csv (27.96 kb)
Looking at the contents, train.csv has a passenger list for about 900 people (with survival results), and test.csv has a passenger list for about 400 people (survival results unknown).
As you can guess from the name, create a prediction model from train.csv, and actually test the passenger list in test.csv to make a prediction. .. I remember hearing somewhere that a prediction model was created from about 70% of the data and tested with the remaining 30% of the data, so this is exactly what it is. I am grateful that the data is separated from the beginning.
Random forest
Since the competition title says to predict using Random Forest, should I use Random Forest? What is Random Forest in the first place? So I looked it up on the Wiki.
Proposed by Leo Breiman in 2001 [1] A machine learning algorithm used for classification, regression and clustering. It is a group learning algorithm that uses a decision tree as a weak learner, and its name is based on the use of a large number of decision trees learned from randomly sampled training data. Depending on the subject, it is also more effective than boosting using group learning. -[WikiPedia](https://en.wikipedia.org/wiki/%E3%83%A9%E3%83%B3%E3%83%80%E3%83%A0%E3%83%95%E3 From% 82% A9% E3% 83% AC% E3% 82% B9% E3% 83% 88)
What is a decision tree in the first place?
The decision tree is one of the learning algorithms, and it is completed by asking a question, branching with Yes and No, and creating a tree structure. The algorithm is "branch until the answer is complete, and if you can't branch any more, stop there". --Quote here

In other words, it seems to be a group learning model that improves accuracy by performing group learning (ensemble learning) with a large number of decision trees. And how to make a decision tree seems to be the heart of the learning model.
Take a look at the data
Open train.csv and take a look.

First, I examined the meaning of variables.
--PassengerID: Passenger ID --Survived: Survival result (1: survival, 2: death) --Pclass: Passenger class 1 seems to be the highest --Name: Passenger's name --Sex: Gender --Age: Age --SibSp Number of siblings and spouses. --Parch: Number of parents and children. --Ticket Ticket number. --Fare Boarding fee. --Cabin Room number --Embarked There are three types of ports on board: Cherbourg, Queenstown, and Southampton.
Let's load csv for the time being. We use pandas, which is good at data processing and aggregation. Gender is difficult to handle as male, female, so male: Male is treated as 0, female: Female is treated as 1.
import pandas as pd
import matplotlib.pyplot as plt

df= pd.read_csv("train.csv").replace("male",0).replace("female",1)
Handling of missing values
There are some missing records in Age. It seems that it is necessary to fill in some value in the missing part, but if you fill it with 0 for the time being, it will affect the prediction model later. In this case, the range is not so wide, so the average age of all passengers is fine, but in this case it is safe to use the median, so I will apply the median where it is missing. ..
df["Age"].fillna(df.Age.median(), inplace=True)
Let's output a histogram for each room grade.
split_data = []
for survived in [0,1]:
    split_data.append(df[df.Survived==survived])

temp = [i["Pclass"].dropna() for i in split_data]
plt.hist(temp, histtype="barstacked", bins=3)
From the left, in the first, second, and third class rooms, the person who survived the green color and the person who died the blue color. It seems that more than half of the passengers in the first-class cabins survive. On the other hand, it seems that only 1/5 of the passengers in the third-class cabin survived. Perhaps the passengers in the first-class cabin were given priority and boarded the lifeboat.

Next, let's put out a histogram for each age.
temp = [i["Age"].dropna() for i in split_data]
plt.hist(temp, histtype="barstacked", bins=16)
 Only the center is protruding. ..
This was due to the fact that I put the median in the missing value instead.
If you are missing the age, omit it and try to output the histogram again.
Only the center is protruding. ..
This was due to the fact that I put the median in the missing value instead.
If you are missing the age, omit it and try to output the histogram again.
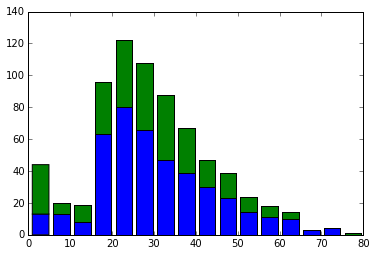
It has a nice shape. When I look at it, the elderly are unexpectedly dead. On the contrary, infants have a fairly high survival rate. From here, it seems that people with babies were given priority in getting on the lifeboat.
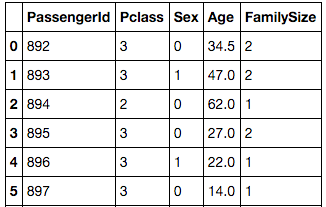
Data shaping
Looking at the data, I thought that large families with 5 or more people had a low survival rate. Looking at the ticket number, it seems that some people are not unique and get the number. I don't know if they were in the same room or if they were purchased together they would have the same number. For example, are all the people with the ticket number "347082" family names? Is the same as "Andersson". Looking at the age, it looks like a family of seven. Since the grade is 3, I wonder if it was a room on the lower floor, all of them are dead. Add a variable for "Number of family members". Then delete unnecessary variables.
df["FamilySize"] = df["SibSp"] + df["Parch"] + 1
df2 = df.drop(["Name", "SibSp", "Parch", "Ticket", "Fare", "Cabin", "Embarked"], axis=1)

It seems that pandas dataframe cannot be passed to scikit-learn as it is due to the difference in type, so let's check the type.
df2.dtypes

#Output result
PassengerId      int64
Survived         int64
Pclass           int64
Sex              int64
Age            float64
FamilySize       int64
dtype: object
It looks like you can pass it without any problems.
Let's actually learn
scikit-learn is a machine learning library for python. Create and predict a decision tree using RandomForestClassifier.
However, since the variables required for training data are Pclass and later, they are separated. PassengerId is not needed because it is an ID that kaggle has assigned. Survived, which is the survival result, is the correct data.
train_data = df2.values
xs = train_data[:, 2:] #Variables after Pclass
y  = train_data[:, 1]  #Correct answer data
Let's actually train and make a prediction model. The number of decision trees is set to 100 based on the Reference site. And the contents of test.csv also format the data in the same way as train.csv.
from sklearn.ensemble import RandomForestClassifier
forest = RandomForestClassifier(n_estimators = 100)

#Learning
forest = forest.fit(xs, y)

test_df= pd.read_csv("test.csv").replace("male",0).replace("female",1)
#Missing value completion
test_df["Age"].fillna(df.Age.median(), inplace=True)
test_df["FamilySize"] = test_df["SibSp"] + test_df["Parch"] + 1
test_df2 = test_df.drop(["Name", "SibSp", "Parch", "Ticket", "Fare", "Cabin", "Embarked"], axis=1)
Ask them to actually make a prediction based on the prediction model.
test_data = test_df2.values
xs_test = test_data[:, 1:]
output = forest.predict(xs_test)
print(len(test_data[:,0]), len(output))
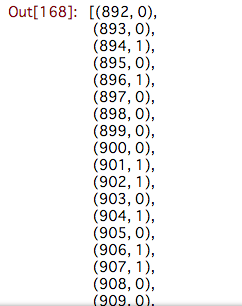
zip_data = zip(test_data[:,0].astype(int), output.astype(int))
predict_data = list(zip_data)
If you look at the contents of predict_data, the results that are predicted are listed.
And finally, let's write the list to csv. You should have predict_result_data.csv in your current directory.
import csv
with open("predict_result_data.csv", "w") as f:
    writer = csv.writer(f, lineterminator='\n')
    writer.writerow(["PassengerId", "Survived"])
    for pid, survived in zip(test_data[:,0].astype(int), output.astype(int)):
        writer.writerow([pid, survived])
Submit to Kaggle
We have created a csv that actually predicted survival by establishing a prediction model. Let's send this to Kaggle. Go to the Titanic competition page and upload and send from "My Submissions" → "Make a submission" in the left column. Then the score will be displayed and you will be ranked.

The score was 0.69856. The baseline score is 0.76555, which is not enough. .. Lol
This time, the mission was to set up a prediction model and send it to Kaggle, so let's do it. ..
Summary
At first I bought and read books on machine learning algorithms, but I felt that it would be best to try them out using a library. There is a nice site called Kaggle, so it might be a good idea to test your skills here or study by looking at scripts written by others. Why don't you start your machine learning life?
Reference site
Kaggle 2nd Titanic Survivor Prediction kaggle first challenge: I tried to predict the survival rate in a random forest from the profile of Titanic passengers Machine Learning Titanic Survivor Prediction with Python
Recommended Posts