[PYTHON] Detailed explanation Performance improvement with NewRelic-Part 3
Detailed explanation: Performance improvement with New Relic-Part 2 is a continuation.
This time, we will introduce Thread Profiler that can be seen in the function called X-Ray Sessions of Key Transactions.

Case 1: I want to see where a particular API is slow but slow on the source
[Case 1 of Part 1](http://qiita.com/wapa5pow/items/e3ef018af270cc2ad014#%E3%82%B1%E3%83%BC%E3%82%B91-%E3%82%A2%E3% 83% 97% E3% 83% AA% E3% 82% B1% E3% 83% BC% E3% 82% B7% E3% 83% A7% E3% 83% B3% E3% 81% AE% E5% BF% 9C% E7% AD% 94% E3% 81% 8C% E9% 81% 85% E3% 81% 84% E3% 81% 91% E3% 81% A9% E3% 82% 82% E3% 81% A3% E3% 81% A8% E6% 97% A9% E3% 81% 8F% E3% 81% AA% E3% 82% 89% E3% 81% AA% E3% 81% 84% E3% 81% 8B) I now know roughly where the API is taking time.
However, there may be times when you want to see in more detail what processing is taking time on a source code basis. At that time, Key Transactions and X- Ray Sessions.
** Key Transactions ** allows you to track requests on a separate page and see detailed logs for each specific API. ** X-Ray Sessions ** will show you the profiler for that particular request.
Let's set it.
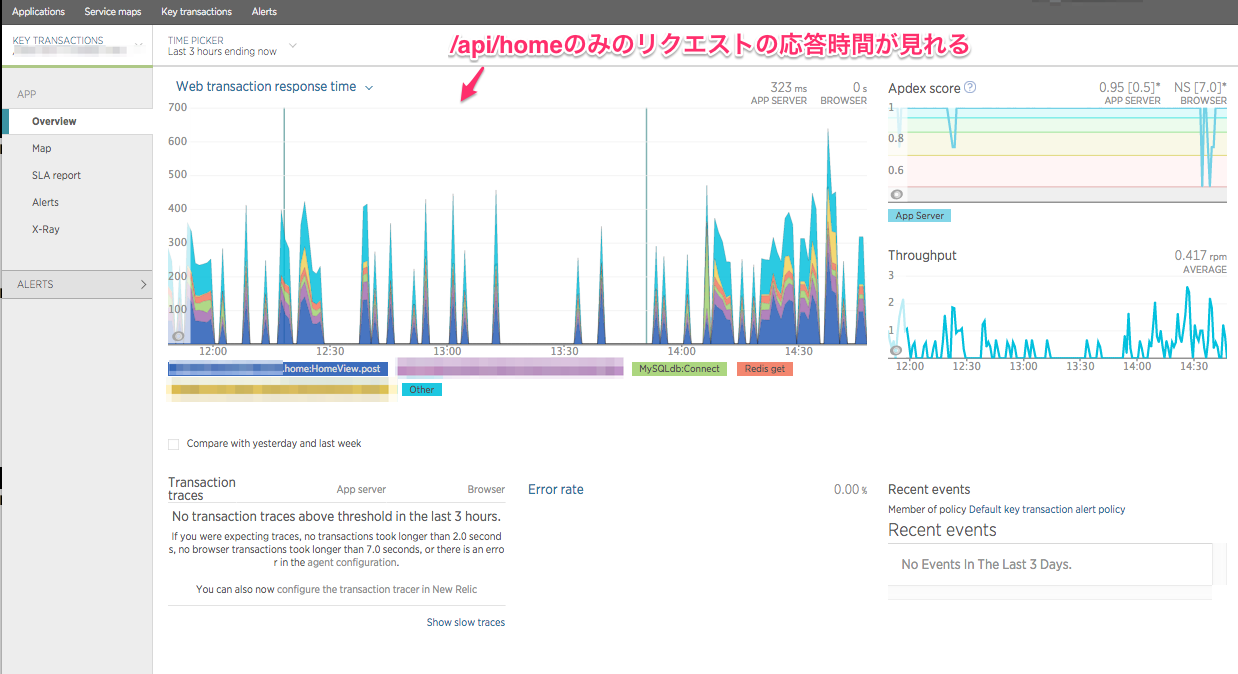
This time, I will add the API path of / api / home as Key Transactions. Click in the order of ① => ② => ③ as shown below. Click the API you care about in ② to track it. In this case, it's the home API.

Since Key Transaction of / api / home can be done, follow the wizard and go to the Key transactions page to see it. In this way, you can see information only for specific API requests.

You can also set Alert etc. by Key transaction, but this time, I will investigate the processing bottleneck with X-Ray.


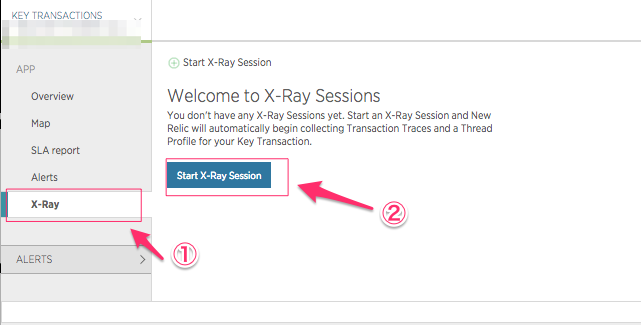
The X-Ray is now set up. Under the name sampling_home, it will track 50 requests over up to an hour. If the server has access, wait for a while, request an API test etc. from the corresponding API and wait for 50 requests to accumulate.
Once you have accumulated, open sampling_home, click X-Ray, and open Thread Profile. You can see the bottleneck in detail because it shows the percentage of time taken for each order in which it was executed. (I'm sorry it's hard to see because it's just a mosaic) However, it should be noted that the waiting time waiting when the CPU is switched due to IO waiting or context switch is also reflected here, so it is for reference only.

Bonus: Investigate the cause of late requests by chance
Key Transactions has another useful feature that allows you to see the details of each tracked request according to response time. With it, it's easy to spot cases where many requests are fast, but sometimes slow, and you can focus only on that particular request to see where it's slowing down.
In addition, you can see the executed ** SQL ** in detail, which is quite useful for troubleshooting and slow queries.

Conclusion
This is the end of the ** detailed explanation NewRelic performance improvement ** that continued from 1 to 3. I think New Relic is a great tool for easily seeing various metrics and freeing up time to develop services that you really need.
Recommended Posts