[PYTHON] Detect river flooding with AI (ternary classification)
Introduction
AI monitors the flooding situation of the river so that it will not get off or approach if it overflows I wondered if I could warn you.
motivation:
(I was free in Corona ... I don't mean. First of all, I wanted to post qiita for the first time.) July 2020 was the longest rainy season ever.
The Kamo River in Kyoto, which I have been watching for 30 years, seems to be flooding every time it rains, and the city prepared a fence so that it would not go down to the riverside, but if you could display the situation on the electronic bulletin board one by one, everyone I thought I was happy. (There should be a disaster prevention camera, I'm sorry if I've already done it. I think you can see the water level, so it may be a good combination with AI) Click here for the URL of the Kyoto City Disaster Prevention Camera


Conclusion first
I noticed that it was difficult to collect images and no results were obtained on the way.
Supplement
So that it can be used by people who are about to start machine learning I used a simple ternary classification framework, so the code is more than the result I would appreciate it if you could refer to it.
I will study how to write and show sentences and codes. Please note that it is not good.
About implementation
I made a ternary classification using Keras. Don't think too much, like a signal ・ Safe situation (blue) ・ A state that requires attention (yellow) ・ Dangerous state (red) I thought it would be enough if it appeared.
・ Safe situation (blue)

・ A state that requires attention (yellow)
 [↑ is reprinted from here. ](https://www.google.com/url?sa=i&url=https%3A%2F%2F4travel.jp%2Ftravelogue%2F11377392&psig=AOvVaw0v1E4ZtZd91XODHGo9-j-Q&ust=1597102591004000&source=images&cd=vfe&ved0CAAQAA
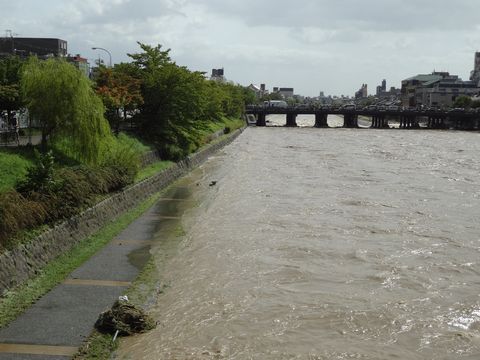
・ Dangerous state (red)

code
The code is listed in git below.
https://github.com/nakamolinto/River_flood_detection
Code reference source
I created it based on the code of kaggle's APTOS competition. https://www.kaggle.com/c/aptos2019-blindness-detection/notebooks?sortBy=voteCount&group=everyone&pageSize=20&competitionId=14774
For all the learning data of the contents, I used the images that are on SNS such as twitter, What is displayed is the image taken by myself without the citation source.
Implementation
** Load the required libraries **
import json
import math
import os

import cv2
from PIL import Image
import numpy as np
from keras import layers
from keras.applications import DenseNet121
from keras.callbacks import Callback, ModelCheckpoint
from keras.preprocessing.image import ImageDataGenerator
from keras.models import Sequential
from keras.optimizers import Adam
import matplotlib.pyplot as plt
import pandas as pd
from sklearn.model_selection import train_test_split
from sklearn.metrics import cohen_kappa_score, accuracy_score
import scipy
import tensorflow as tf
from tqdm import tqdm
import glob

%matplotlib inline
** Reading data ** This time, I put it in three data folders and read it.
#Safe situation (blue)
files=glob.glob("./images/ok/*")
dfok=pd.DataFrame(files,columns=["id_code"])
dfok["diagnosis"]=0
dfok.shape

#State that needs attention(yellow)
files=glob.glob("./images/bad/*")
dfbad=pd.DataFrame(files,columns=["id_code"])
dfbad["diagnosis"]=1
dfbad.shape

#Dangerous condition(red)
files=glob.glob("./images/ng/*")
dfng=pd.DataFrame(files,columns=["id_code"])
dfng["diagnosis"]=2
dfng.shape


dfall=pd.concat([dfok,dfbad,dfng])
dfall.shape

dfall['diagnosis'].hist()
dfall['diagnosis'].value_counts()
dfall.shape

** Data splitting and resizing, etc. ** ** The image size is set to 32 due to spec issues, but 256 * 256 is better if you can use the GPU. ** **
from sklearn.model_selection import train_test_split

train_df, test_df=train_test_split(dfall,test_size=0.20)
train_df.shape

def get_pad_width(im, new_shape, is_rgb=True):
    pad_diff = new_shape - im.shape[0], new_shape - im.shape[1]
    t, b = math.floor(pad_diff[0]/2), math.ceil(pad_diff[0]/2)
    l, r = math.floor(pad_diff[1]/2), math.ceil(pad_diff[1]/2)
    if is_rgb:
        pad_width = ((t,b), (l,r), (0, 0))
    else:
        pad_width = ((t,b), (l,r))
    return pad_width

def preprocess_image(image_path, desired_size=32):
    im = Image.open(image_path)
    im = im.resize((desired_size, )*2, resample=Image.LANCZOS)

    return im
N = train_df.shape[0]
x_train = np.empty((N, 32, 32, 3), dtype=np.uint8)

for i, image_id in enumerate(tqdm(train_df['id_code'])):
    x_train[i, :, :, :] = preprocess_image(image_id)
x_train.shape

N = test_df.shape[0]
x_test = np.empty((N, 32, 32, 3), dtype=np.uint8)

for i, image_id in enumerate(tqdm(test_df['id_code'])):
    x_test[i, :, :, :] = preprocess_image(image_id)


y_train = pd.get_dummies(train_df['diagnosis']).values

print(x_train.shape)
print(y_train.shape)
print(x_test.shape)

y_train_multi = np.empty(y_train.shape, dtype=y_train.dtype)
y_train_multi[:, 2] = y_train[:, 2]

for i in range(2):
    y_train_multi[:, i] = np.logical_or(y_train[:, i], y_train_multi[:, i+1])

print("Original y_train:", y_train.sum(axis=0))
print("Multilabel version:", y_train_multi.sum(axis=0))

x_train, x_val, y_train, y_val = train_test_split(
    x_train, y_train_multi,
    test_size=0.15,
    random_state=2019
)
Check the number of data in each class.

** Class definition **
class MixupGenerator():
    def __init__(self, X_train, y_train, batch_size=32, alpha=0.2, shuffle=True, datagen=None):
        self.X_train = X_train
        self.y_train = y_train
        self.batch_size = batch_size
        self.alpha = alpha
        self.shuffle = shuffle
        self.sample_num = len(X_train)
        self.datagen = datagen

    def __call__(self):
        while True:
            indexes = self.__get_exploration_order()
            itr_num = int(len(indexes) // (self.batch_size * 2))

            for i in range(itr_num):
                batch_ids = indexes[i * self.batch_size * 2:(i + 1) * self.batch_size * 2]
                X, y = self.__data_generation(batch_ids)

                yield X, y

    def __get_exploration_order(self):
        indexes = np.arange(self.sample_num)

        if self.shuffle:
            np.random.shuffle(indexes)

        return indexes

    def __data_generation(self, batch_ids):
        _, h, w, c = self.X_train.shape
        l = np.random.beta(self.alpha, self.alpha, self.batch_size)
        X_l = l.reshape(self.batch_size, 1, 1, 1)
        y_l = l.reshape(self.batch_size, 1)

        X1 = self.X_train[batch_ids[:self.batch_size]]
        X2 = self.X_train[batch_ids[self.batch_size:]]
        X = X1 * X_l + X2 * (1 - X_l)

        if self.datagen:
            for i in range(self.batch_size):
                X[i] = self.datagen.random_transform(X[i])
                X[i] = self.datagen.standardize(X[i])

        if isinstance(self.y_train, list):
            y = []

            for y_train_ in self.y_train:
                y1 = y_train_[batch_ids[:self.batch_size]]
                y2 = y_train_[batch_ids[self.batch_size:]]
                y.append(y1 * y_l + y2 * (1 - y_l))
        else:
            y1 = self.y_train[batch_ids[:self.batch_size]]
            y2 = self.y_train[batch_ids[self.batch_size:]]
            y = y1 * y_l + y2 * (1 - y_l)

        return X, y
** Data padding etc. **
#Batch size
BATCH_SIZE = 16

def create_datagen():
    return ImageDataGenerator(
        zoom_range=0.15,  # set range for random zoom
        # set mode for filling points outside the input boundaries
        fill_mode='constant',
        cval=0.,  # value used for fill_mode = "constant"
        horizontal_flip=True,  # randomly flip images
        vertical_flip=True,  # randomly flip images
    )

# Using original generator
data_generator = create_datagen().flow(x_train, y_train, batch_size=BATCH_SIZE, seed=2019)
# Using Mixup
mixup_generator = MixupGenerator(x_train, y_train, batch_size=BATCH_SIZE, alpha=0.2, datagen=create_datagen())()

class Metrics(Callback):
    def on_train_begin(self, logs={}):
        self.val_kappas = []

    def on_epoch_end(self, epoch, logs={}):
        X_val, y_val = self.validation_data[:2]
        y_val = y_val.sum(axis=1) - 1

        y_pred = self.model.predict(X_val) > 0.5
        y_pred = y_pred.astype(int).sum(axis=1) - 1

        _val_kappa = cohen_kappa_score(
            y_val,
            y_pred,
            weights='quadratic'
        )

        self.val_kappas.append(_val_kappa)

        print(f"val_kappa: {_val_kappa:.4f}")

        if _val_kappa == max(self.val_kappas):
            print("Validation Kappa has improved. Saving model.")
            self.model.save('model.h5')

        return

#Let's do DenseNet. You can try various models by changing the model here.
densenet = DenseNet121(
    weights="imagenet",
    include_top=False,
    input_shape=(32,32,3)
)

def build_model():
    model = Sequential()
    model.add(densenet)
    model.add(layers.GlobalAveragePooling2D())
    model.add(layers.Dropout(0.5))
    model.add(layers.Dense(3, activation='sigmoid'))

    model.compile(
        loss='binary_crossentropy',
        optimizer=Adam(lr=0.00005),
        metrics=['accuracy']
    )

    return model
** Build the model **
model = build_model()
model.summary()

kappa_metrics = Metrics()
** Model summary **

** Learn Feel free to change the epock **
history = model.fit_generator(
    data_generator,
    steps_per_epoch=x_train.shape[0] / BATCH_SIZE,
    epochs=50,
    validation_data=(x_val, y_val),
    callbacks=[kappa_metrics])
** Infer **
model.load_weights('model.h5')
y_val_pred = model.predict(x_val)
def compute_score_inv(threshold):
    y1 = y_val_pred > threshold
    y1 = y1.astype(int).sum(axis=1) - 1
    y2 = y_val.sum(axis=1) - 1
    score = cohen_kappa_score(y1, y2, weights='quadratic')

    return 1 - score

simplex = scipy.optimize.minimize(
    compute_score_inv, 0.5, method='nelder-mead'
)

best_threshold = simplex['x'][0]

y_test = model.predict(x_test) > 0.5
y_test = y_test.astype(int).sum(axis=1) - 1

test_df['prediction'] = y_test
test_df.to_csv('kamogawa_result.csv',index=False)
** Let's check the inference result **
test_df
 ↑ The above is a result that cannot be predicted at all. .. ..
** Last output part **
prediction=test_df.prediction
id=test_df.id_code
%matplotlib inline
plt.figure(figsize=(16,12))

for num,i  in enumerate(zip(prediction,id)):
    plt.subplot(4,2,num+1)
    if i[0] == 0 :
        print("The waters of today's rivers are safe.")
        image=cv2.imread(i[1],1)
        plt.title("safe")
#         plt.title(i[1])
        plt.imshow(image)
    elif i[0] ==1 :
        print("Please note that the water level of the river is rising.")
        image=cv2.imread(i[1],1)
#         plt.title(i[1])
        plt.title("be careful")
        plt.imshow(image)
    else :
        print("The river is flooding. Never get off the riverside")
        image=cv2.imread(i[1],1)
#         plt.title(i[1])
        plt.title("Do NOT enter")
        plt.imshow(image)
** Output example **

I output it for the time being.
Impressions
It is easy to understand the safe state and the dangerous state, but there are not many images of the caution state, It was hard to find, I gave up on the way and did it with a ray. If you want to do it properly, it's faster to take it yourself. Also, I couldn't use the GPU and reduced the image size to 32, but if I study with 224 * 224, I may be able to infer properly.
Since we have already seen the flooding of the river with sensors etc., it may not be necessary to use AI, It may be useful for detecting if there are any people on the side of the river at night. Next, I think I'll try object detection.
If you find any code mistakes, please let us know.
excuse
If you can collect enough beautiful images, you will get good predictions. If anyone involved in the river, try it.
Reference URL
https://qiita.com/yu4u/items/078054dfb5592cbb80cc
https://www.kaggle.com/c/aptos2019-blindness-detection/notebooks?sortBy=voteCount&group=everyone&pageSize=20&competitionId=14774
http://www.qsr.mlit.go.jp/useful/n-shiryo/kikaku/kenkyu/h30/04/4_03(18).pdf
Code (repost)
The code is listed in git below. If you have any questions about the code, please feel free to contact us. https://github.com/nakamolinto/River_flood_detection
Finally
I also do twitter. Please follow me if you like. https://twitter.com/pythonmachine