[PYTHON] Predicting the future with machine learning-Predicting future stock prices with scikit-learn decision trees
This article is a continuation of previous, but [machine learning with scikit-learn](http://qiita.com/ynakayama/items/ I would like to write a story that actually predicts the future using 9c5867b6947aa41e9229).
Anyway, first look at the figure below.

This time as well, we will use stock price data as the data to be tested. The figure above shows the stock price of our company (DTS), which is genuine data.
As shown in the figure, let the computer learn the information "what happened as a result from the change in the stock price in the past" using machine learning, and try to predict the future stock price based on it.
Decision tree algorithm
This time, we will use a decision tree (digi tree) from among many classification methods. Please refer to Previously written article for the reason for selecting the method.
I think it would be quick to read the explanation of the decision tree itself around Wikipedia. I will.
You can also find a description of the decision trees implemented in scikit-learn in the Official Documentation (http://scikit-learn.org/stable/modules/tree.html).
When you read the document, it seems that something difficult is written in English, but in a nutshell, how to use scikit-learn is to learn the array of numerical values (train_X) and the array of results (train_y) of teacher data. If you give an array of numbers (test_X) of test data, the prediction result (test_y) will be returned.
This time we're focusing on how to use it, so let's skip the detailed theory and give it a try.
The stock price data at the time of writing is as follows.
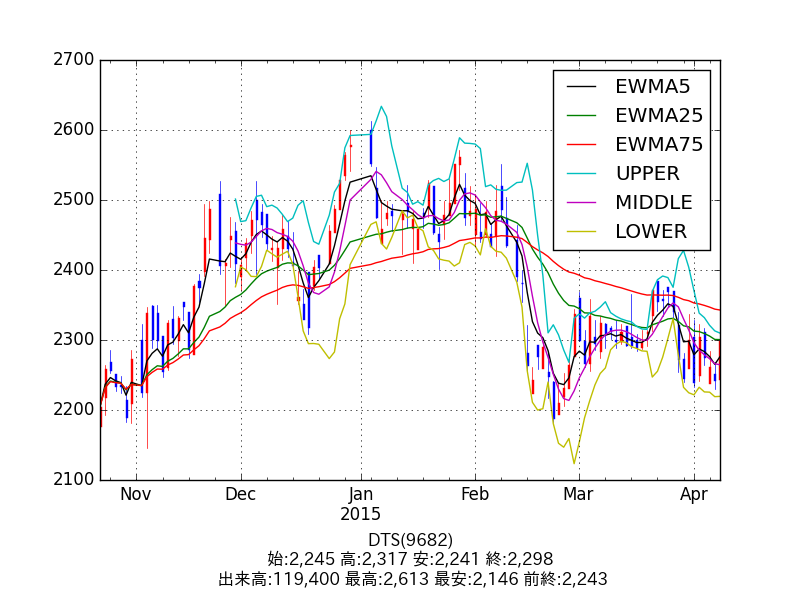
This is the data from 4/8 of DTS (9682) for the past 120 business days [matplotlib](http: It is plotted at //matplotlib.org/). In the daily chart, red is the positive line, blue is the negative line, EWMA is the exponential smoothing moving average, and the remaining three are Bollinger bands.
Create teacher data
First, prepare the code from the most troublesome stock price adjusted closing price to the creation of teacher data. This would be good if you passed a list of closing prices and it would return train_X and train_y.
def train_data(arr):
    train_X = []
    train_y = []
    #Learn 30 days of data and shift back one day at a time
    for i in np.arange(-30, -15):
        s = i + 14 #Make 14 days of change a feature
        feature = arr.ix[i:s]
        if feature[-1] < arr[s]: #Did the stock price rise the next day?
            train_y.append(1) #If YES, 1
        else:
            train_y.append(0) #0 for NO
        train_X.append(feature.values)
    #Returns the result of raising and lowering and a set of teacher data
    return np.array(train_X), np.array(train_y)
This will return train_X (an array of teacher data) and train_y (a label of 1 or 0 for it).
Calculate the return index
By the way, if the raw stock price data is used as it is, the price range is completely different for each company, so it is a little difficult to use as teacher data. Normalization is fine, but here is the change in asset value Let's pay attention to the return index that represents. I wrote previous as the calculation method, but it can be calculated by pandas like this.
returns = pd.Series(close).pct_change() #Find the rate of increase / decrease
ret_index = (1 + returns).cumprod() #Find the cumulative product
ret_index[0] = 1 #First value 1.Set to 0
Let the decision tree learn the change in the return index
Well, here is the kimo. Teacher data is extracted from the return index obtained in this way and trained by the classifier.
#Retrieving teacher data from the return index
train_X, train_y = train_data(ret_index)
#Instantiate a decision tree
clf = tree.DecisionTreeClassifier()
#To learn
clf.fit(train_X, train_y)
After that, by passing the test data to the clf.predict () function, the prediction result will be returned.
If 1 is returned, the stock price will "rise" If 0 is returned, the stock price will "fall" It will be predicted.
Try a classifier to see if you learned well
Let's try it right away. First of all, as a test, let's run the exact same data as the teacher data as test data.
test_y = []
#Test with data from the last 30 days
for i in np.arange(-30, -15):
    s = i + 14
    #Let's classify the exact same period of the return index as a test
    test_X = ret_index.ix[i:s].values

    #Store and return results
    result = clf.predict(test_X)
    test_y.append(result[0])

print(train_y) #The answer you should expect
#=> [1 1 1 0 1 1 0 0 0 1 0 1 0 0 0]

print(np.array(test_y)) #Prediction issued by the classifier
#=> [1 1 1 0 1 1 0 0 0 1 0 1 0 0 0]
Oh, exactly the same. In other words, it seems that all the questions are correct.
Predict the closing price of 4/9
Now let's predict the stock price on 4/9 at the time of writing.
Based on the data for 90 business days up to 4/8, this is what we expected.
[ 1.00834065  1.01492537  1.04126427  1.03424056  1.03467954  1.0403863
  1.02765584  0.99780509  0.98595259  1.00965759  0.9833187   1.01141352
  0.99912204  0.99297629] # 4/14-day return index up to 8
[0] #Predictions derived from it
The answer is 0, which means that the stock price will go down.
By the way, if you look at the Yahoo! Finance page after the market closes on 4/9, as expected.
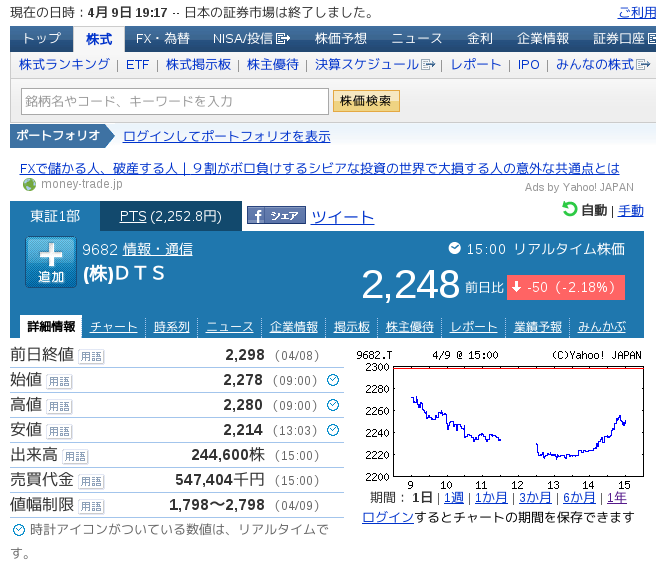
The yen depreciated by 50 yen, which means that the stock price fell as expected by the decision tree. Is the correct answer.
Predict the closing price of 4/10
Finally, let's challenge the prediction of the future. Predict the closing price of 4/10.
It seems to be persistent, but this article was written on 4/9. please confirm.
[ 1.01492537  1.04126427  1.03424056  1.03467954  1.0403863   1.02765584
  0.99780509  0.98595259  1.00965759  0.9833187   1.01141352  0.99912204
  0.99297629  0.98463565] # 4/14-day return index up to 9
[1] #The decision tree is predicted to be 1
The answer is 1, which means that stock prices are expected to rise tomorrow.
Summary
What did you think. I think I was able to make some interesting predictions.
If this is a hit rate out of 100, you can make a profit by buying today and selling tomorrow. Perhaps the prediction was wrong, and I may be thinking that I wrote a disappointing article by this time tomorrow.
I think investors are desperately looking at the stock chart and predicting whether it will go up or down tomorrow. What I wrote this time is to use a decision tree, which is a machine learning method, and try to let a computer do this. So-called artificial intelligence.
Of course, referring to what is written here, we do not guarantee even if you actually make a genuine transaction, and the author will not take any responsibility even if damage occurs. Please note that point.
Recommended Posts