Identify threads in the Java process that are wasting CPU
Overview
I will show you how to identify the threads that are wasting CPU in the Java process. Not only Linux but also Windows method is posted.
Prerequisites
JDK installed
For Linux
First, the Linux method. It would be nice if the same thing could be done on Windows (see below).
(1) Specify the ID of the target Java process with the jps command
$ jps
25830 Jps
25800 EmbeddedJettyServer
25769 Launcher
(2) Use the top command to grasp the CPU usage status of the target Java process for each thread.
$ top -n 1 -H -p 25800

top - 21:29:39 up 23:36,  3 users,  load average: 1.66, 0.97, 0.52
Tasks:  31 total,   1 running,  30 sleeping,   0 stopped,   0 zombie
Cpu(s):  2.9%us,  0.8%sy,  0.0%ni, 96.2%id,  0.1%wa,  0.0%hi,  0.0%si,  0.0%st
Mem:   3909512k total,  3778736k used,   130776k free,     9520k buffers
Swap:  2031612k total,    52248k used,  1979364k free,   366352k cached

   PID USER      PR  NI  VIRT  RES  SHR S %CPU %MEM    TIME+  COMMAND
 25826 root      20   0 3912m 332m  16m R 95.9  8.7   1:34.14 java
 25800 root      20   0 3912m 332m  16m S  0.0  8.7   0:00.00 java
 25804 root      20   0 3912m 332m  16m S  0.0  8.7   0:04.61 java
 25805 root      20   0 3912m 332m  16m S  0.0  8.7   0:00.59 java
 25806 root      20   0 3912m 332m  16m S  0.0  8.7   0:00.01 java
 25807 root      20   0 3912m 332m  16m S  0.0  8.7   0:00.02 java
 25808 root      20   0 3912m 332m  16m S  0.0  8.7   0:00.00 java
 25809 root      20   0 3912m 332m  16m S  0.0  8.7   0:00.00 java
 25810 root      20   0 3912m 332m  16m S  0.0  8.7   0:00.00 java
In the above case, you can see that the thread with PID "25826" is consuming 95.9% of CPU.
(3) Convert "25826" to hexadecimal with the following command.
$ printf %x\\n 25826
64e2
(4) Get a thread dump of the target Java process with the jstack command
$ jstack 25800 > thread_dump.txt
(5) Open thread_dump.txt with a text editor and search for nid = 0x64e2 to identify the thread.
"qtp2122049087-23" #23 prio=5 os_prio=0 tid=0x00007f5368f2b000 nid=0x64e2 runnable [0x00007f53a06b7000]
   java.lang.Thread.State: RUNNABLE
        at org.apache.log4j.Category.getEffectiveLevel(Category.java:442)
        at org.apache.log4j.Category.isDebugEnabled(Category.java:736)
        at org.slf4j.impl.Log4jLoggerAdapter.debug(Log4jLoggerAdapter.java:250)
        at org.t246osslab.easybuggy.troubles.InfiniteLoopServlet.doGet(InfiniteLoopServlet.java:24)
        at javax.servlet.http.HttpServlet.service(HttpServlet.java:668)
        at javax.servlet.http.HttpServlet.service(HttpServlet.java:770)
        at org.eclipse.jetty.servlet.ServletHolder.handle(ServletHolder.java:684)
        at org.eclipse.jetty.servlet.ServletHandler$CachedChain.doFilter(ServletHandler.java:1507)
        at org.t246osslab.easybuggy.core.filters.AuthenticationFilter.doFilter(AuthenticationFilter.java:72)
        at org.eclipse.jetty.servlet.ServletHandler$CachedChain.doFilter(ServletHandler.java:1495)
        at org.t246osslab.easybuggy.core.filters.SecurityFilter.doFilter(SecurityFilter.java:51)
        at org.eclipse.jetty.servlet.ServletHandler$CachedChain.doFilter(ServletHandler.java:1495)
        at org.t246osslab.easybuggy.core.filters.EncodingFilter.doFilter(EncodingFilter.java:42)
        at org.eclipse.jetty.servlet.ServletHandler$CachedChain.doFilter(ServletHandler.java:1487)
        at org.eclipse.jetty.servlet.ServletHandler.doHandle(ServletHandler.java:499)
        at org.eclipse.jetty.server.handler.ScopedHandler.handle(ScopedHandler.java:137)
For Windows
(1) Specify the ID of the target Java process with the jps command
> jps
9488 Jps
5256 Launcher
3948 EmbeddedJettyServer
(2) Use Process Explorer to understand the CPU usage status of the target Java process for each thread.
On Windows without the top command, use a tool called Process Explorer (https://technet.microsoft.com/en-us/sysinternals/bb896653.aspx). Just download and click the exe file to launch it.

Once you find the process you are looking for, right-click and click Properties.

A window similar to the following will be displayed, so check the TID of the thread that is consuming the CPU.

In the above case, you can see that the thread with PID "9292" is consuming 26.47% of CPU.
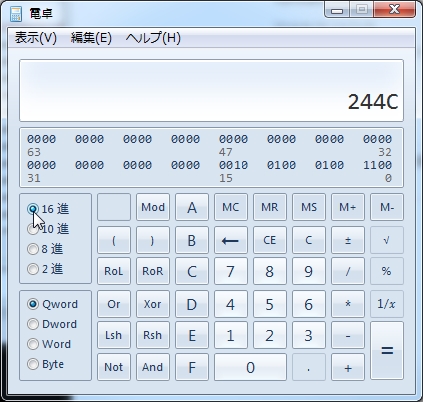
(3) Convert "9292" to a hexadecimal number with a scientific calculator (because it is Windows).

The hexadecimal number of "9292" is 244c.
(4) Get a thread dump of the target Java process with the jstack command
> jstack 3948 > thread_dmup.txt
(5) Open the output file (thread_dmup.txt) and search for nid = 0x244c to identify the thread.

Recommended Posts