[PYTHON] Artificial satellite image analysis by Google Earth Engine and Google Colab-Satellite image analysis starting for free (Introduction)-
Introduction
――In recent years, the number of cases where artificial satellite data is used in society and business is increasing. --Artificial satellites observe the state of the earth from space with various sensors, and they are released as ** open data **. ――Satellite data is big data and has a high affinity with recent machine learning and AI technologies, but the required processing resources (storage memory) tend to be enormous, and in a personal PC environment. The hurdle is high to use ――However, by using the cloud resources provided by Google, ** individuals can also perform satellite data analysis ** for free. --In this article, we will introduce satellite data analysis methods using ** Google Earth Engine (GEE) ** and ** Google Colaboratory (Colab) **. ――In the [Application], which will be released at a later date, I would like to introduce the handling of typical data (ground surface temperature, vegetation index, snow cover index) that can be obtained from satellite data. ――In satellite data analysis, you can capture various global environmental conditions by combining various sensors. ** Let's use the contents of this article as an introduction to data analysis of familiar environmental conditions **. I think it's interesting
Features of this article
--Usually, GEE analyzes using JavaScript on browsing. --However, ** I want to analyze with Python, which has a rich library of machine learning and statistical analysis **, so ** only the minimum processing (extraction and storage of satellite images) is performed with GEE's Python API **, and * * I will show you how to perform visualization and analysis with the normal python library (numpy or matplotlib) **. ――In addition, I want to analyze a large amount of satellite image data without depending on the resources of the local PC, so I will introduce a method to complete the process only in the ** cloud environment of Google Colab + Google Drive ** (of course). , If you specify the save destination locally, you can analyze in the local environment as well)
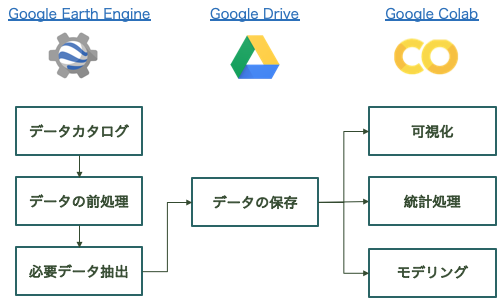
Image of proper use of services ~ Perform satellite image analysis using only cloud services using Google services ~
Overview of Google Earth Engine (GEE)
--Google releases service in December 2010 --You can perform analysis on the GEE server without downloading the artificial satellite image to your own personal computer. --In normal satellite data analysis, it is necessary to support different data formats and preprocess data, but various satellite data are prepared on GEE, and only the necessary data can be loaded and used. --Can be used free of charge for research, education, and non-profit purposes (paid plans are also available) --Note) This service is different from Google Earth, which allows you to browse the globe.
Overview of Google Colaboratory (Colab)
--A service that allows you to write and execute Python from a browser without building an environment --GPU can also be used for free --There are many easy-to-understand articles on the outline and usage of Google Colab, so please refer to them. -Introduced Google Colab -Summary of how to use Google Colab
[How to use] Satellite image analysis on GEE & Colab
Account preparation
- Sign up from the official page of Google Earth Engine (Google account required)
- After signing up, you will be able to access the Data Catalog, which is a list of satellite data available on GEE.
Using GEE in Python environment (Google Colab)
1. Authenticate GEE from Google Colab using Python API
#Earth Engine Python API Import
import ee
#GEE authentication / initialization
ee.Authenticate()
ee.Initialize()
--When you execute GEE authentication, the URL required for authentication is displayed. --When you access the URL and specify your Google account, the verification code will be displayed. --Copy the verification code to the Google Colab box
2. Load GEE satellite data
--Select the ** satellite name ** you want to load from the data catalog --Here, select DMSP-OLS, which collects nighttime-light data. --For night light, refer to Past article "What is night light data?" --Select the ** band name ** you want to load data from --Usually, artificial satellites acquire data in multiple bands (sensors with different wavelengths), so specify the band name that suits your purpose. --Here, select'avg_vis', which is the main body of night light data. --'avg_vis' is a sensor that expresses the intensity of night light with an integer value from 0 to 63. --Specify the ** period ** for which you want to load data --Usually, satellites are time-series data that continue to be observed recursively (observation frequency varies depending on the satellite). --Select the period of data you want to acquire there --Specify the ** area ** where you want to load data --Since artificial satellites observe the entire earth, specify the required area. --Here, the method of extracting data as a rectangle using latitude and longitude is adopted. --Specify with ee.Geometry.Rectangle ([xMin, yMin, xMax, yMax]) --xMin = (lower left longitude), yMin = (lower left latitude), xMax = (upper right longitude), yMax = (upper right latitude)
#Specify satellite name
satellite = 'NOAA/DMSP-OLS/NIGHTTIME_LIGHTS'
#Specify the band name
band = 'avg_vis'
#Specify the period
from_date='2010-01-01'
to_date='2012-12-31'
##Specify area(Specify latitude / longitude in Japan area)
geometry = ee.Geometry.Rectangle([128.60, 29.97, 148.43, 46.12])

#Load data from GEE under specified conditions
dataset = ee.ImageCollection(satellite).filter(
    ee.Filter.date(from_date, to_date)).filter(
    ee.Filter.geometry(geometry)).select(band)
――Since this satellite product is an annual data set, there are data for three years from 2010 to 2012. ――Measurement frequency differs depending on the satellite, and it is necessary to note that a large amount of data will be loaded if a long period is specified for satellites with fine time resolution (example: satellites observed every 12 days). --The number of target data can be confirmed with the following command.
#Confirmation of the number of target data
print(dataset.size().getInfo())
3. Saving satellite image data
--Save the specified satellite data to Google Drive --You can save any image by converting it to the list format. --By using ee.batch.Export.image.toDrive, the data will be saved in the specified folder in My Drive of Google Drive. --You can also specify the resolution of the image with scale when downloading the image.
##Convert to list format
data_list = dataset.toList(dataset.size().getInfo())
#Get the 0th image (2010 image)
image = ee.Image(data_list.get(0))

#Save to Gdrive
task = ee.batch.Export.image.toDrive(**{
    'image': image,#Specifying the target data
    'description': 'sample_dataloading_NTL',#Specifying the file name
    'folder':'GEE_download',# Google Drive(MyDrive)Folder name
    'scale': 1000,#Specifying the resolution
    'region': geometry.getInfo()['coordinates']#Target area specified above
})

#Execution of processing
task.start()
--When you execute the above command, a file called sample_dataloading_NTL will be saved in Google Drive> My Drive> GEE_download. --It takes time depending on the size of the data to be loaded, and you can check the progress with task.active (). If task.active () = True, GEE is processing, so wait until it becomes False.
#Check the data processing status (True indicates that processing is in progress)
task.active()
4. Confirmation of saved satellite image
--Data is saved in TIF format --Therefore, use rasterio to read TIF format data and use matplotlib for visualization. --See below for how to handle TIF data and how to use rasterio [Introduction] Artificial satellite data analysis by Python (Google Colab environment)
#Package installation&import
!pip install rasterio
import numpy as np
import matplotlib.pyplot as plt
import rasterio

#Data reading
with rasterio.open('/content/drive/My Drive/GEE_download/sample_dataloading_NTL.tif') as src:
    arr = src.read()

#Get data in numpy format-> (1, 1847, 2208)Get in an array of
print(arr.shape)

#Visualization
plt.imshow(arr[0])
"2010 DMSP-OLS night light data"
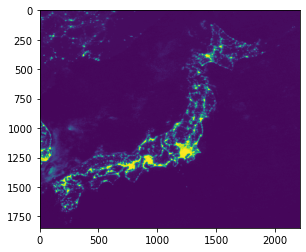
--Since arr is in numpy format, you can calculate the statistics of satellite data, acquire the data of the next year and compare it in time series, and perform analysis freely. --Also, by using vector files and geopandas introduced in Past Articles, you can hollow out and visualize data by country or prefecture. It is also possible to calculate the change
Functionalization of a series of processes
--Finally, make the above series of processes into a function. ――Next time, I would like to use this function to perform analysis using various indicators (ground surface temperature, vegetation index, snow cover index, etc.) observed using artificial satellites.
#Earth Engine Python API Import
import ee

#GEE authentication / initialization
ee.Authenticate()
ee.Initialize()

#GEE data load
def load_data(snippet, from_date, to_date, geometry, band):
    #Extract data according to parameter conditions
    dataset = ee.ImageCollection(snippet).filter(
    ee.Filter.date(from_date, to_date)).filter(
    ee.Filter.geometry(geometry)).select(band)
    #Convert to list type
    data_list = dataset.toList(dataset.size().getInfo())
    #Output the number of target data and data list
    return dataset.size().getInfo(), data_list

#Save satellite imagery to Google Drive
def save_on_gdrive(image, geometry, dir_name, file_name, scale):
    task = ee.batch.Export.image.toDrive(**{
        'image': image,#Satellite information to load
        'description': file_name,#File name to save
        'folder':dir_name,#Save destination folder name
        'scale': scale,#resolution
        'region': geometry.getInfo()['coordinates'],#Target area
        'crs': 'EPSG:4326'
    })
    # Run exporting
    task.start()
    print('Done.')

##Parameter specification
#Designate satellite
snippet = 'NOAA/DMSP-OLS/NIGHTTIME_LIGHTS'
#Specify the band name
band = 'avg_vis'
#Specify the period
from_date='2010-01-01'
to_date='2012-12-31'
#Specify area(Specify latitude / longitude in Japan area)
geometry = ee.Geometry.Rectangle([128.60, 29.97, 148.43, 46.12])
#Folder name to save
dir_name = 'GEE_download'
#file name
file_name = 'file_name'
#resolution
scale = 1000

##Execution of processing----------------------------------------------
num_data, data_list = load_data(snippet=snippet, from_date=from_date, to_date=to_date, geometry=geometry, band=band)
print('#Datasets; ', num_data)

##Save all (File name uses satellite ID)
for i in range(data_list.size().getInfo()):
    image = ee.Image(data_list.get(i))
    save_on_gdrive(image, geometry, dir_name, image.getInfo()['id'].replace('/', '_'), scale)
at the end
――In this article, we introduced the method of satellite image analysis using various Google services (GEE, Colab and Drive). ――By using GEE, it is attractive to be able to use various satellite datasets listed in the data catalog with the same command (usually, when using satellite datasets, different formats and complexity for each operating institution are used. Preprocessing is required, but by using GEE, analysts can focus on analysis and utilization.) -Although it is not introduced in this article from basic visualization and analysis by using Goole Colab, it is easy to switch to the GPU environment and extend it to machine learning training using satellite data as input. can do -GEE's Data Catalog has a lot of datasets, so I'm interested in global environment analysis with this article as a starting point. I hope you can bring it
Recommended Posts