[PYTHON] Detect post-it notes from whiteboard images
Good evening. mixi Group Advent Calendar 2015 This is the article on the 14th day! ~~ Actually, I have also registered at Diverse Advent Calendar 2015. ~~ It seemed that duplicate registration was not possible m (_ _) m Thank you.
background
Suddenly, do you all use whiteboards? In the mixi group, some departments have incorporated Scrum into their development methods, and in many cases Whiteboard + Post-it plays a part in task management. It may be unpleasant for IT companies in the IT era to use analog methods for task management, albeit partially, but it is important to make good use of the good points of both digital and analog.
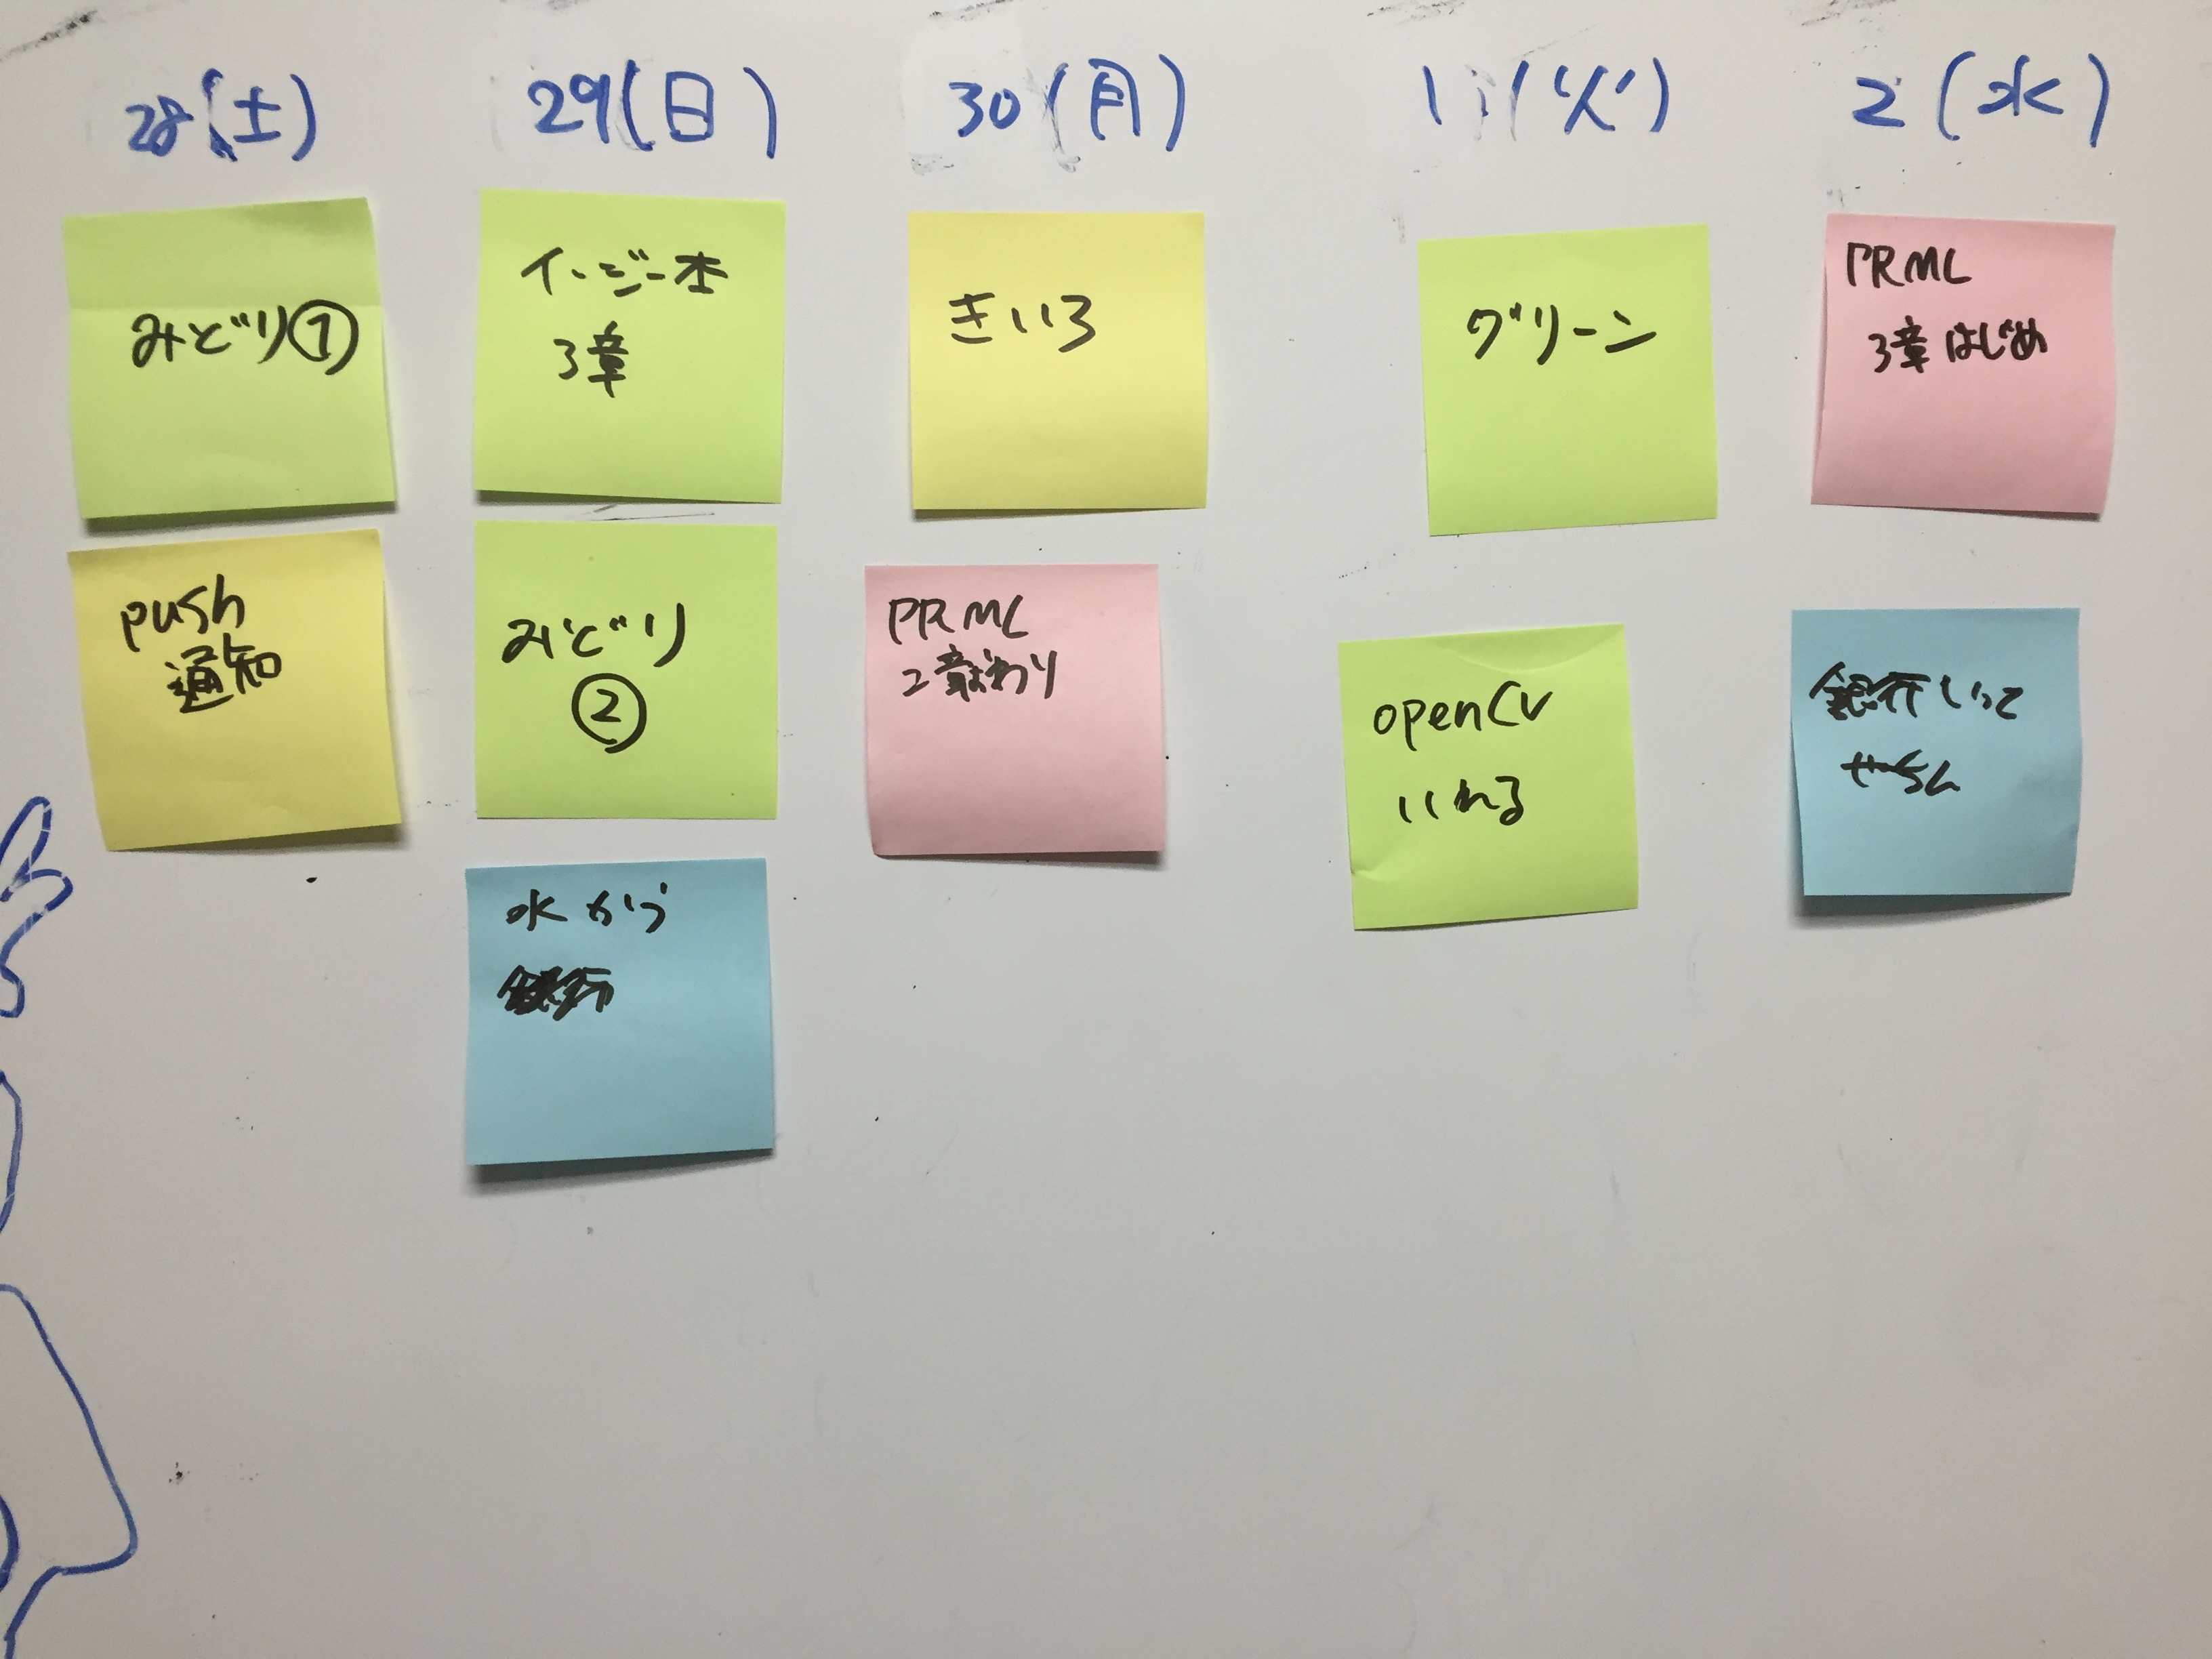
By the way, I am also a person who works for such an IT company, so naturally I have a whiteboard at home (↓ figure of the whiteboard at home).
 (It was dirty so I tried my best to clean it)
It's very nice to be able to wake up every morning and check various things by writing and pasting the task on a post-it note, but when I go out, I tend to forget what the task was.
This time, in order to realize the desire to "check the whiteboard while on the go!", I tried to take a picture of the whiteboard and manage Post-it notes digitally, so I will introduce the path. (If there is a better way! I would appreciate it if you could point it out!)
Environment: Python 3.4.3 (pyenv), OpenCV 3.0.0
flow
--Installing OpenCV --Contour detection from image binarization --Get the post-it part --Clustering with post-it colors
OpenCV installation
In the pyenv environment, you can easily install it if you have Anaconda installed.
conda install -c https://conda.binstar.org/menpo opencv
This time I wanted to use it on the existing environment with pyenv, so I installed it with homebrew.
brew tap homebrew/science
brew install opencv3 --with-python3
brew link opencv3 --force
You need to link to make OpenCV available from Python 3 in the pyenv environment.
ln -s /usr/local/Cellar/opencv3/3.0.0/lib/python3.4/site-packages/cv2.so ~/[pyenv_path]/versions/3.4.3/lib/python3.4/site-packages/cv2.so
If you can import cv2 in an interpreter environment such as ipython, you're done.
$ ipython
In [1]: import cv2
In [2]: cv2.__version__
Out[2]: '3.0.0'
Contour detection from image binarization
Since the image is binarized using OpenCV and only the post-it part is extracted from it, the outline part of the post-it is acquired. This time I used this photo of my whiteboard!
First of all, the part up to binarization.
image_dir = './image/'
image_file = 'xxx.jpg'
im = cv2.imread(image_dir + image_file, 1) #(A)
im_gray = cv2.cvtColor(im, cv2.COLOR_BGR2GRAY) #(B)
im_blur = cv2.GaussianBlur(im_gray, (11, 11), 0) #(C)
The image is read in 3 color channels in (A), but it is necessary to convert it to a grayscale image in order to perform binarization, and this is done in (B). The second argument of (B) is a constant, and various other conversions such as BGR2HSV can be performed by cvtColor. Gaussian blur is applied in (C) to make it easier to determine the threshold of the grayscale image.
The image that has been preprocessed is binarized. Binarization replaces an image given in grayscale with (basically) two colors, 0 and 255. The threshold function is used here, but there are a threshold function that sets the threshold for the whole and an adaptiveThreshold function that sets the threshold adaptively according to the part.
ret1, th1 = cv2.threshold(im_blur, 127, 255, cv2.THRESH_BINARY_INV)
th2 = cv2.adaptiveThreshold(im_blur, 255, cv2.ADAPTIVE_THRESH_GAUSSIAN_C, cv2.THRESH_BINARY_INV, 11, 3)
threshold uses the second argument as the threshold and binarizes the entire image. The fifth argument of adaptiveThreshold is the range you see when taking the threshold, and the final threshold is the threshold calculated from that range minus the sixth argument. There are two ways to calculate the in-range threshold: cv2.ADAPTIVE_THRESH_MEAN_C, which simply averages the pixels in the range, and cv2.ADAPTIVE_THRESH_GAUSSIAN_C, which takes the average with Gaussian weights.
The 4th argument of threshold and the 3rd argument of adaptiveThreshold take various other constants. Please see the reference list for details.
The figure below shows the application to an appropriate image.

Since I want to detect the post-it part this time, I used the OTSU algorithm, which is an algorithm that determines the threshold well, as the threshold that determines the threshold as a whole. It's very easy to use, just add a little to the previous function.
th = cv2.threshold(blur, 0, 255, cv2.THRESH_BINARY_INV+cv2.THRESH_OTSU)[1]
Briefly, the OTSU algorithm (Otsu algorithm) is not particularly difficult, and is generally called discriminant analysis method, Fisher's linear discrimination, etc. When there are two classes (here, the background of the image and the object, etc.), (1) the variance within each class is small, and (2) the variance between the classes is large, these (1) and (2) We are looking for a threshold that will meet. Therefore, there is no need to set a threshold value by people, and if you pass only the image, the optimum threshold value will be calculated automatically. If you want to know more, please check with "discriminant analysis method".
Applying this to the first photo I raised, it looks like this:
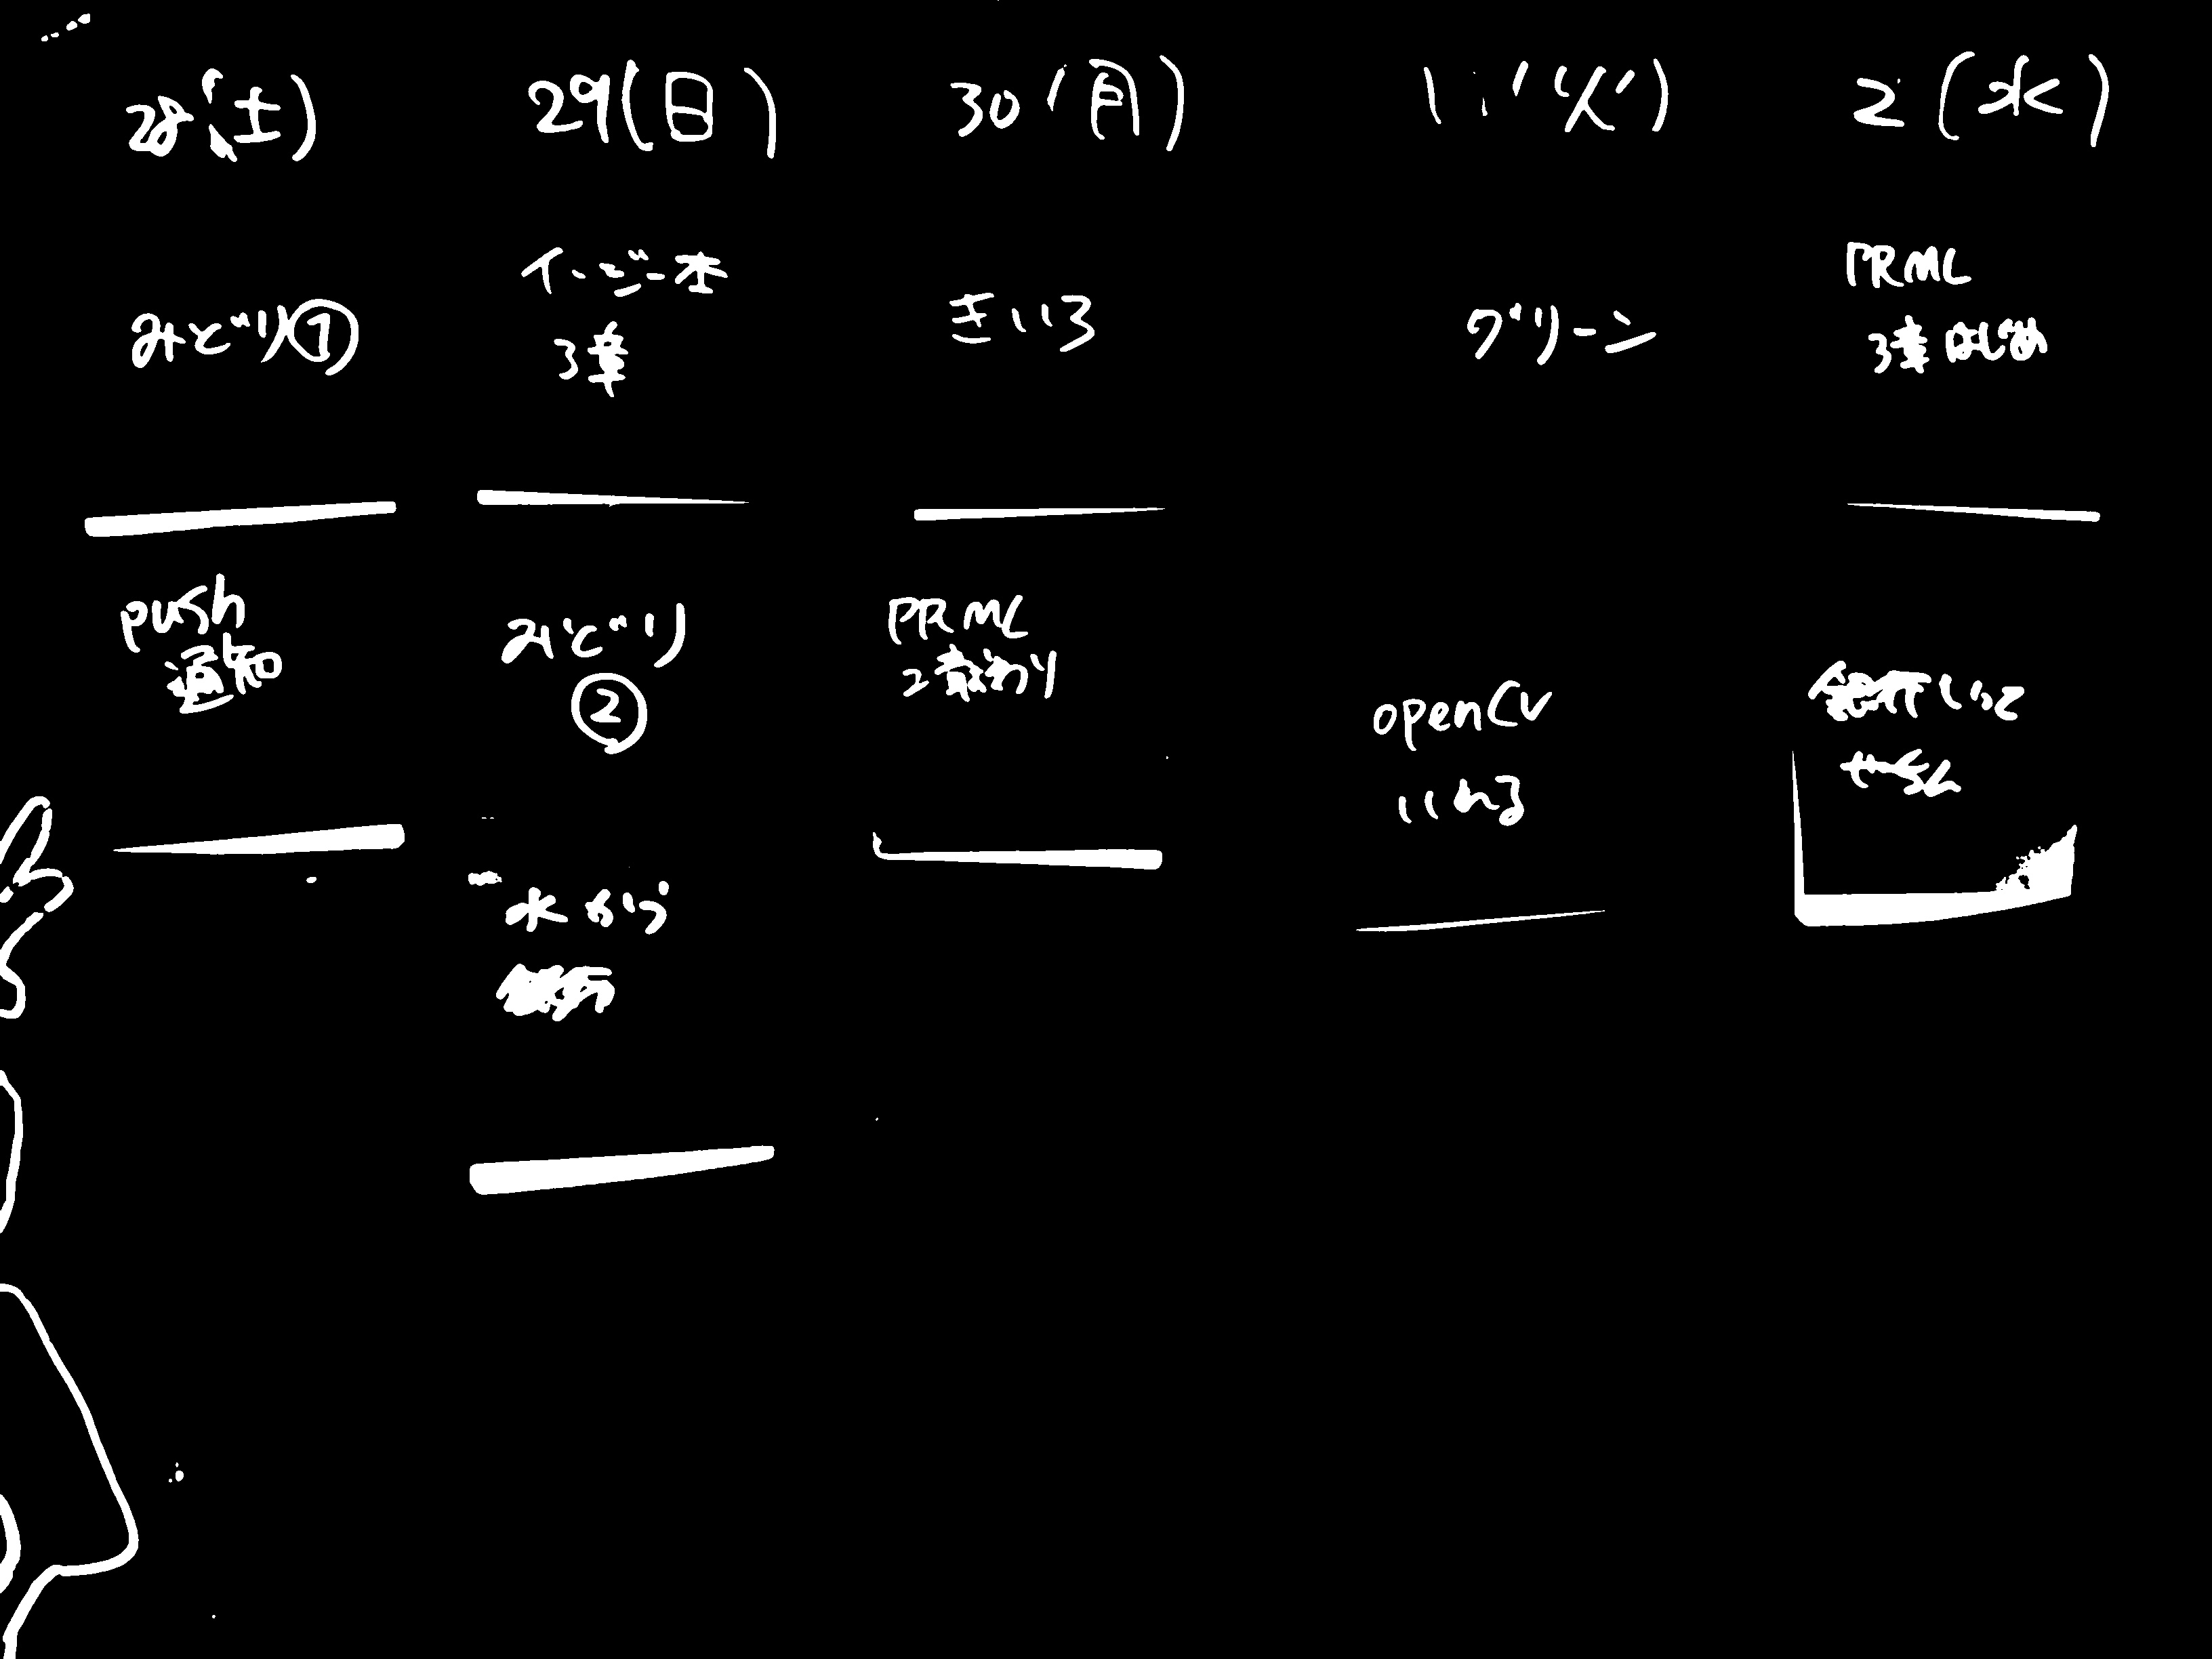
** I can't get it at all! !! !! !! !! ** ** It just seems that the dirty characters stand out. I couldn't get it just by making it grayscale, so this time I used the sum of the following 5 binarized images as the final binarized image.
- Binarized original image using cvtColor
- A one-dimensional grayscale image of the values of each of the three original color channels
- The sum of the red of the three color channels minus the other blue and green (created to forcefully remove red because it was difficult to remove, using im as the original image, the following values)
(np.abs(int_im[:,:,2] - int_im[:,:,1]) + np.abs(int_im[:,:,2] - int_im[:,:,0]))
Here are the images created by creating 5 types of binarized images from these and taking the sum of all of them!

It's becoming like that.
Next, I want to get the coordinates of the contour, but since OpenCV already has a findContours function to extract the contour, I will use it.
contours = cv2.findContours(im_th, cv2.RETR_LIST, cv2.CHAIN_APPROX_SIMPLE)[1]
This makes it possible to obtain information on the contour part.
Get the post-it part
After that, based on the vertices of the acquired contour, only the part whose area is larger than a certain size is extracted, the linear approximation is performed by the approxPolyDP function, and the obtained quadrilateral part is cut out from the original image and saved.
# filtered with area over (all area / 100 )
th_area = im.shape[0] * im.shape[1] / 100
contours_large = list(filter(lambda c:cv2.contourArea(c) > th_area, contours))

outputs = []
rects = []
approxes = []

for (i,cnt) in enumerate(contours_large):
	arclen = cv2.arcLength(cnt, True)
	approx = cv2.approxPolyDP(cnt, 0.02*arclen, True)
	if len(approx) < 4:
		continue
	approxes.append(approx)
	rect = getRectByPoints(approx)
	rects.append(rect)
	outputs.append(getPartImageByRect(rect))
	cv2.imwrite('./out/output'+str(i)+'.jpg', getPartImageByRect(rect))
Here, as getPartImageByRect and getPartImageByRect, we have prepared a function to get the image obtained by cutting out the specified range from the following image.
def getRectByPoints(points):
	# prepare simple array
	points = list(map(lambda x: x[0], points))

	points = sorted(points, key=lambda x:x[1])
	top_points = sorted(points[:2], key=lambda x:x[0])
	bottom_points = sorted(points[2:4], key=lambda x:x[0])
	points = top_points + bottom_points

	left = min(points[0][0], points[2][0])
	right = max(points[1][0], points[3][0])
	top = min(points[0][1], points[1][1])
	bottom = max(points[2][1], points[3][1])
	return (top, bottom, left, right)

def getPartImageByRect(rect):
	img = cv2.imread(image_dir + image_file, 1)
	return img[rect[0]:rect[1], rect[2]:rect[3]]
Now you can cut out the post-it part from the original image. The next image is the one that I put a frame in the original image.

All post-it notes have been successfully detected. After that, if you have each image in the application or manage it on the server, you can open the way to digital management.
Clustering with post-it colors
Where Post-it notes are used, I think they often categorize tasks by color. It's a big deal, so let's manage that as well. Consider the following flow.
- Acquisition of representative color
- Clustering
- Frame the average color of the same cluster as the color of that category
First, get the representative colors of each cropped image. Currently, only the post-it part is cropped, so it is thought that this image contains three colors: surrounding white, post-it color, and text color black. In other words, if you simply use the median of each color channel as the representative color, you can get the post-it color.
t_colors = []
for (i,out) in enumerate(outputs):
	color = np.zeros(3)
	for j in range(3):
		color[j] = np.median(out[:,:,j])
	t_colors.append(color)
t_colors = np.array(t_colors)
Next, the representative values of each of the obtained post-it notes were clustered using the KMeans method. For clustering by KMeans method, please refer to many easy-to-understand explanations on the net such as Qiita.
from sklearn.cluster import KMeans
# KMeans
cluster_num = 4 # num of colors
kmeans = KMeans(n_clusters=cluster_num).fit(t_colors)
labels = kmeans.labels_
centers = np.array(kmeans.cluster_centers_).astype(np.int) # convert into int to express color
Now, here is the color (and number) of the clustered result added to the original image! It's pretty hard to see, but I've added a label for the clustering results from 0 to 3 at the top left of Post-it.

Looking at the results, blue and red are clustered well, but the class is a mixture of yellow and yellow-green, probably because of the light. This may change again if you convert to HSV and include saturation information as we used only the elements of each of the RGB channels of the image for clustering, but that's it for this time.
from now on
In this example, I have confirmed the operation of only my whiteboard at home, so I need to make it more widely usable. In addition, clustering is also insufficient, and at present it is not possible to respond when the number of colors increases. Also, it seems foolish to take a picture every morning by myself, so I would like to pull the proud Raspberry Pi and automate everything, so I will write it as a continuation.
Summary
When I was trying to write an article that promoted the introduction of whiteboards at home, I couldn't really touch it. Let's install a whiteboard at home as well. You can manage tasks, calculate, and write notes. You can make a lot of progress.
Tomorrow, @isaoshimizu will write something. Thank you.
reference
Create a Python 3.4 + OpenCV 3.0 environment on your Mac https://librabuch.jp/2015/07/python-34_opencv-30_mac/
Contour extraction with OpenCV http://docs.opencv.org/master/d4/d73/tutorial_py_contours_begin.html#gsc.tab=0
cv2.threshold (OpenCV 2.1) http://opencv.jp/opencv-2.1/cpp/miscellaneous_image_transformations.html#cv-threshold
cv2.adaptiveThreshold (OpenCV 2.1) http://opencv.jp/opencv-2.1/cpp/miscellaneous_image_transformations.html#cv-adaptivethreshold
cv2.findContours (OpenCV 2.1) http://opencv.jp/opencv-2.1/cpp/structural_analysis_and_shape_descriptors.html#cv-findcontours