Chord recognition using chromagram of python library librosa
This is @namaozi. This article is eeic Advent Calendar 2016 Day 9 article ** Part 2 **.
If you want to start watching from ** Part 2 ** suddenly, please read ** Part 1 ** first.
Last time, I made a spectrogram to visualize the music signal.
This time using a chromagram
Let's challenge the chord recognition of.
What you want to do in this article
- Try to recognize chords using a chromagram
- I want to make it readable by people who do not understand math and programming as much as possible.
- I want to include qualitative and musical stories as much as possible
Notice
I will use the library.
[Part 1] In (), I implemented the spectrogram using only numpy, but if I implemented the chord recognition of the chromagram, accuracy was too garbage of garbage, so I rely on the library. I'll decide </ font>, it's a pitiful story ... (´ ・ _ ・ `)
So, in this article, I will use the advanced python voice signal analysis library ** librosa ** to get the chromagram and recognize the chords. Let's do it. If you want to try it, please install librosa from the link first.
I'm using python2.7
I'm very sorry, but I'm using python2.7 in this sample ... I'd like to support 3.0 soon.
Language problems
There are various musical terms, but I think it's okay to go through the basics if you don't understand. If you are interested, please refer to the link. For the time being, it's okay if you know that the ** chord is a chord and the named chord is a chord **.
What is chord recognition?
** A task that lets the computer copy chord progressions **.
In fact, the task of estimating chords is a very difficult problem, and research is still ongoing. Although the accuracy has improved year by year, it has not yet reached the stage of listening to chords as flexibly as a trained human being.
If you want to know more, please read Articles around here. The chromagram to be dealt with this time is also written. For the latest method, see This blog.
Actually, implementation using ** Hidden Markov Model (HMM) is the mainstream, but since implementation is difficult, I would like to challenge code recognition using only chromagram as a simplified version this time.
What is a chromagram?
Chromagram provides power for all frequency bands [C, Db, D, Eb, E, F, Gb, G, Ab, A, Bb, B ] Is dropped into the 12 scales, and the sound components at a certain section time are visualized. I will explain with an image of the English wiki.
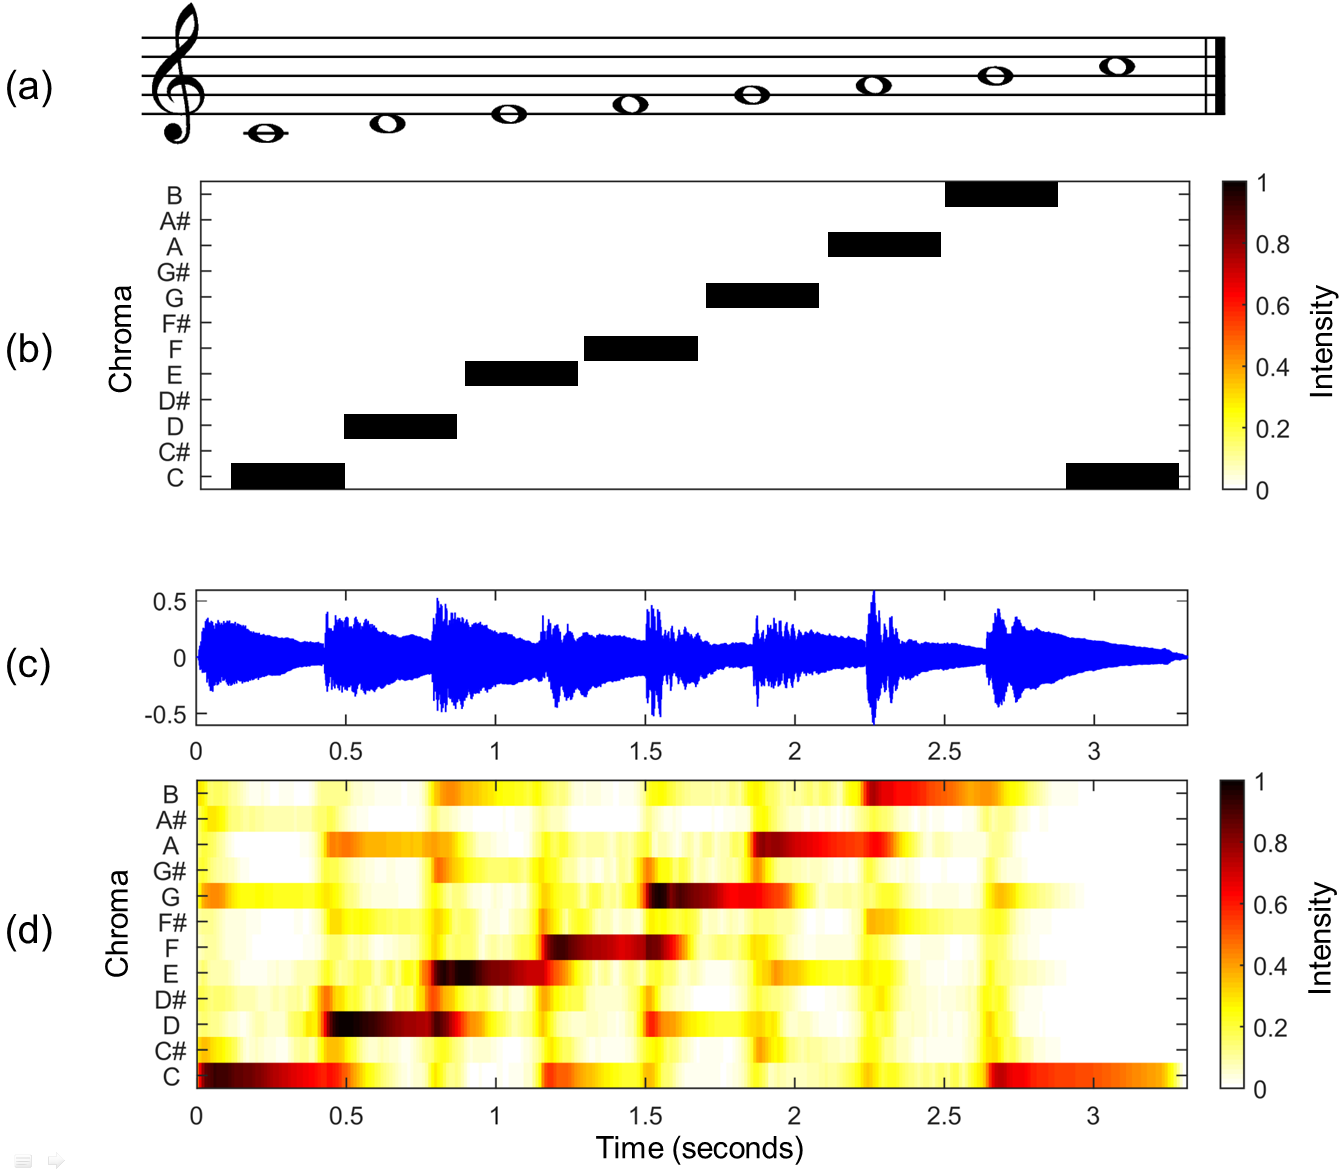
(a) is a score in which the sounds of the white keys of the C major scale, the so-called piano, are lined up. (b) becomes the theoretical chroma vector corresponding to (a), but if you create a chromagram from (c), which is the waveform of the sound actually played on the C major scale (C major), (d) It looks like. As an image, is it ** the feeling that all the music signals are pushed into one octave of the piano roll **?
Since the signal at each time can be expressed by the strength of the twelve-tone components, it is also called ** chroma vector **.
How do you do it after all?
How do you recognize the code?
** "How much does the music signal chromagram resemble the chroma vector of the chord you want?" **
The code for each time will be decided according to. Specifically, the procedure is as follows.
** 1. ** Create a chroma vector (template vector) for the code you want to recognize
** 2. ** Make a music chromagram
** 3. ** Calculate the similarity between the chromagram and template vector at each time, and estimate the code with the highest similarity as the code at that time.
1. Make a template vector
First, create an ideal chroma vector for the chord you want to recognize. Hereafter, we will refer to these ideal chroma vectors as ** template vectors **.
For example, Diatonic Code is a template vector that looks like the figure below. By the way, a diatonic chord is a chord in which the constituent tones of a certain key are deposited three times, that is, skipped by one (there are diatonic chords in each major and minor, but the image below is in major).

By the way, the color of the chroma vector in the above image is different even though it was black earlier, because the sum of the powers of each pitch class at a certain time is aligned to 1.
The formula at the bottom of the image above is a formula representation of the C major code template vector. 12 types of [Pitch Class] for each dimension (https://ja.wikipedia.org/wiki/%E3%83%94%E3%83%83%E3%83%81%E3%82%AF%E3% It corresponds to 83% A9% E3% 82% B9), and it goes up by a semitone in order from C.
2. Make a chromagram
Make the chromagram introduced earlier. Rely on librosa from the God Library. As a side note, I am analyzing the separated percussive components. If you are curious about what you are doing inside, go to God Document Please refer.
The code is on GitHub so please give it a try. https://github.com/namaozi/ChromagramSample
functions.py
def librosa_chroma(file_path="audios/harmony1.wav", sr=44100):
    #import(Cannot be used without installation)
    import librosa

    #Read(sr:Sampling rate)
    y, sr = librosa.load(file_path, sr=sr)

    #Divide into musical tone components and percussive components
    y_harmonic, y_percussive = librosa.effects.hpss(y)

    #Calculate the chromagram
    C = librosa.feature.chroma_cens(y=y_harmonic, sr=sr)

    #Plot
    plt.figure(figsize=(12,4))
    librosa.display.specshow(C, sr=sr, x_axis='time', y_axis='chroma', vmin=0, vmax=1)
    plt.title('Chromagram')
    plt.colorbar()
    plt.tight_layout()
    plt.show()

    return C
###
You can calculate the chromagram in just a few lines. Hah Library God ...
The following is the obtained chromagram.
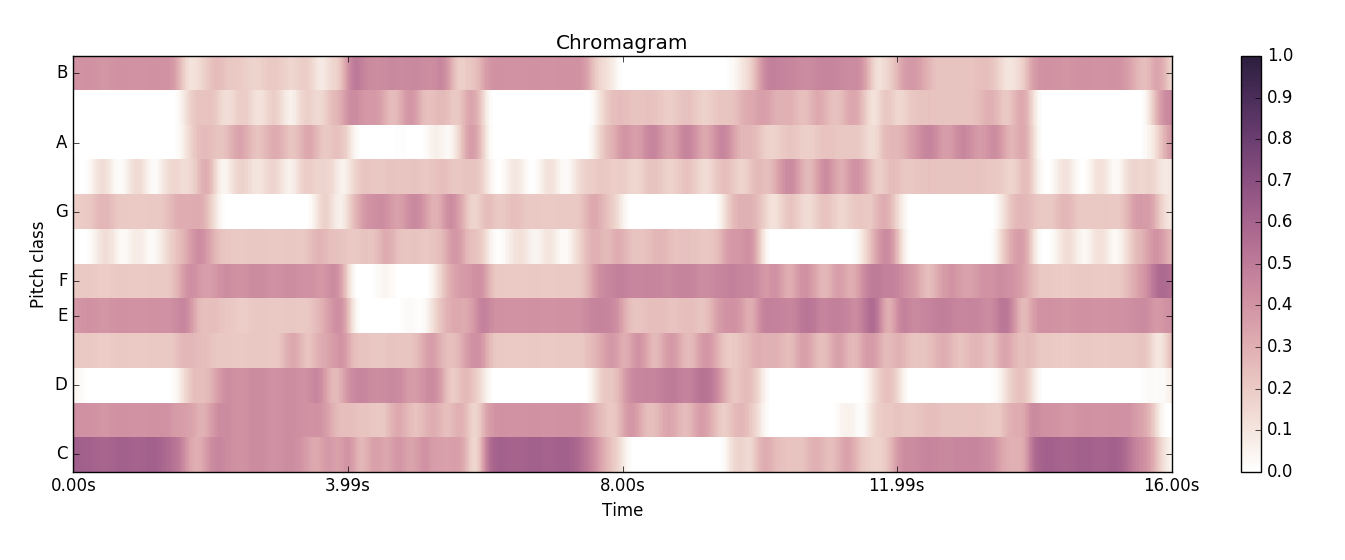
This sample sound source is BPM120
The chord is extended by 4 beats, that is, by 2 seconds. If you look at the obtained chromagram, you can see that the shade of color changes at the timing of the chord change every 2 seconds, and the sound component of the signal changes. [^ 1]
Furthermore, for example, the third, the chromagram of the G major chord between 4 seconds and 6 seconds has a darker color in the ** D, G, B ** part, which is the constituent note of the ** G major chord. Match **. It seems that you can understand the code just by looking at the chromagram![^ 2]
[^ 1]: Actually, it is necessary to calculate from where to which section the chord is, but in this sample sound source, the chord changes every 2 seconds, so give that information to the program. I will end up.
[^ 2]: If you are interested, I put some sample sound sources in the audios folder, so it may be interesting to listen to them and make a chromagram. Whereas harmony1.wav was only organ chords and drums, harmony2.wav added bass and harmony3.wav was a sound source with more melody. When you actually look at the chromagram, the part corresponding to the melody or bass sound should appear darker.
3. Code estimation
All you have to do is estimate the code along the time axis.
chordestimation.py
#coding:utf-8
from collections import OrderedDict
import numpy as np
import matplotlib.pyplot as plt
import librosa #Please install!

import soundanalysis as sa

file_path = "audios/"
file_name = "harmony1.wav"

#Ask for a chromagram
chroma = sa.librosa_chroma(file_path + file_name)

TONES = 12 #Pitch class,Number of sound types
sampling_rate = 44100 #Sound source dependent

# "With this setting",You will be asked to set the time axis like this
# (Please read the documentation for details)
time_unit = 512.0 / 44100 #1 frame chromagram length
# stop = time_unit * (chroma.shape[1] - 1)
stop = time_unit * (chroma.shape[1])
time_ruler = np.arange(0, stop, time_unit)

###Code template vector
#Consider only majors and minors
#Brain muscle code,I didn't have time ...
#I use Ordered Dict because I want to keep the order
one_third = 1.0/3
chord_dic = OrderedDict()
chord_dic["C"] = [one_third, 0,0,0, one_third, 0,0, one_third, 0,0,0,0]
chord_dic["Db"] = [0, one_third, 0,0,0, one_third, 0,0, one_third, 0,0,0]
chord_dic["D"] = [0,0, one_third, 0,0,0, one_third, 0,0, one_third, 0,0]
chord_dic["Eb"] = [0,0,0, one_third, 0,0,0, one_third, 0,0, one_third, 0]
chord_dic["E"] = [0,0,0,0, one_third, 0,0,0, one_third, 0,0, one_third]
chord_dic["F"] = [one_third, 0,0,0,0, one_third, 0,0,0, one_third, 0,0]
chord_dic["Gb"] = [0, one_third, 0,0,0,0, one_third, 0,0,0, one_third, 0]
chord_dic["G"] = [0,0, one_third, 0,0,0,0, one_third, 0,0,0, one_third]
chord_dic["Ab"] = [one_third, 0,0, one_third, 0,0,0,0, one_third, 0,0,0]
chord_dic["A"] = [0, one_third, 0,0, one_third, 0,0,0,0, one_third, 0,0]
chord_dic["Bb"] = [0,0, one_third, 0,0, one_third, 0,0,0,0, one_third, 0]
chord_dic["B"] = [0,0,0, one_third, 0,0, one_third, 0,0,0,0, one_third]
chord_dic["Cm"] = [one_third, 0,0, one_third, 0,0,0, one_third, 0,0,0,0]
chord_dic["Dbm"] = [0, one_third, 0,0, one_third, 0,0,0, one_third, 0,0,0]
chord_dic["Dm"] = [0,0, one_third, 0,0, one_third, 0,0,0, one_third, 0,0]
chord_dic["Ebm"] = [0,0,0, one_third, 0,0, one_third, 0,0,0, one_third, 0]
chord_dic["Em"] = [0,0,0,0, one_third, 0,0, one_third, 0,0,0, one_third]
chord_dic["Fm"] = [one_third, 0,0,0,0, one_third, 0,0, one_third, 0,0,0]
chord_dic["Gbm"] = [0, one_third, 0,0,0,0, one_third, 0,0, one_third, 0,0]
chord_dic["Gm"] = [0,0, one_third, 0,0,0,0, one_third, 0,0, one_third, 0]
chord_dic["Abm"] = [0,0,0, one_third, 0,0,0,0, one_third, 0,0, one_third]
chord_dic["Am"] = [one_third, 0,0,0, one_third, 0,0,0,0, one_third, 0,0]
chord_dic["Bbm"] = [0, one_third, 0,0,0, one_third, 0,0,0,0, one_third, 0]
chord_dic["Bm"] = [0,0, one_third, 0,0,0, one_third, 0,0,0,0, one_third]

prev_chord = 0
sum_chroma = np.zeros(TONES)
estimate_chords = []

result = np.zeros((TONES * 2, 8))

for time_index, time in enumerate(time_ruler):
    #What number of code are you parsing now?
    #It changes every 2 seconds, so divide by 2 to find it.
    nth_chord = int(time) / 2

    #When moving to the next 2 seconds,Estimate the chord for the previous 2 seconds
    if nth_chord != prev_chord:
        maximum = -100000
        this_chord = ""
        #Examine the code that maximizes the cosine similarity
        for chord_index, (name, vector) in enumerate(chord_dic.iteritems()):
            similarity = sa.cos_sim(sum_chroma, vector)
            result[chord_index][nth_chord - 1] = similarity
            if similarity > maximum:
                maximum = similarity
                this_chord = name
        #Stores the initialized and estimated code
        sum_chroma = np.zeros(TONES)
        estimate_chords.append(this_chord)

    else:
        #I will add while paying attention to the shape of chroma
        for i in range(TONES):
            sum_chroma[i] += chroma[i][time_index]

    #update
    prev_chord = nth_chord
###

#The final result
print estimate_chords


###Good luck plot
axis_x = np.arange(0, 16, 2)
bar_width = 0.07
colors = ["#ff9999", "#ffaf95","#fabb92","#ffd698","#fae991","#c1fc97","#97fac8","#96f9f5","#98e1fb","#9cb2ff","#b79bfe","#fa96f9", "#b36a6a", "#ab7361","#aa7d61","#ad9165","#b4a765","#8ab66b","#6ab48f","#68b0ad","#689fb3","#6979b0","#7462a3","#aa62a9"]
for i, (name, vector) in enumerate(chord_dic.iteritems()):
    plt.bar(axis_x - ((axis_x[1] - axis_x[0]) * 0.45) + bar_width * i, result[i], color=colors[i], width = bar_width, label = name, align = "center")

plt.legend()
plt.xticks(axis_x + bar_width / 24)
plt.show()
The result obtained by executing the above code! !! !!

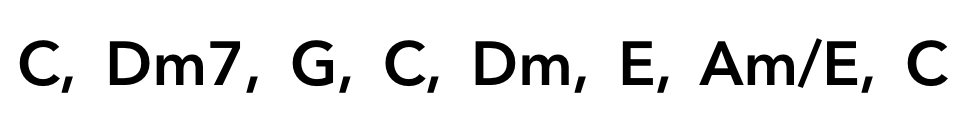
I got the code string! !!
The code for Entered song is
However, this time only major and minor chords can be recognized, so the second ** Dm7 ** (D minor seventh) cannot output the correct answer in the first place. Considering that the constituent sounds of Dm7 are [D, F, A, C], if it is D minor or F major, it can be recognized as it is. In the output, ** F major ** is obtained, so it's almost correct. The 7th chord ** Am / E ** also has the same constituent notes as Am, so the output Am is the correct answer.
In this way, the sample sound source "harmony1.wav" was able to output almost correct answers for all chords using chromagrams and template vectors! </ font> Congratulations. [^ 3]
[^ 3]: Unfortunately, it is unlikely that a song in the real world can be copied so well from a simple chromagram. harmony1.wav had a very simple composition of chords + drums only, but many songs in the real world are complicated songs using an infinite number of tracks. If the melody of the singing voice is included in it, it will be greatly affected, so it will be even more difficult to estimate the chords. As mentioned in footnote 1, it is also difficult to estimate "which interval is the chord", which makes the chord analysis task even more difficult.
The figure below plots the similarity to all the codes in each interval (you can get it by running the above program), which is not a very clean visualization, but ...

Looking at this figure (do your best), for example, in the first 0 to 2 seconds section, the similarity of ** C ** is the highest, but in addition to that, ** Cm ** of the same main chord. You can see that the similarity is also high in the parallel main chords ** Am ** and the genre (IIIm) main chords ** Em **.
You can see that the similarities of the main chords of the relative keys are similar in this way </ font>. It may be interesting to reconsider music theory from such a mathematical interpretation.
Summary
--python is good --librosa strongest --Let's find out if the library can do it before implementing it yourself --Code recognition is quite difficult even with the strongest library
Recommended Posts