Basics of Python x GIS (Part 3)
The first is here Part 2 is here University of Helsinki Teaching Materials We will summarize the answers and supplements for Week5-Week6.
Week5
5-1 Creating a static map
In Week5, the original notebook does not exist, so you will be required to read the README on Github, select the appropriate material yourself, and visualize the map.
5-2 Creating a dynamic map
Week6
6-1 Guess the location of the store
In the first half of Week6, we will use OSM (Open Street Map) to estimate the departure and arrival points of the movement data given in advance. The mplleaflet library allows you to plot shapes created with matplotlib on an interactive map. (For mplleaflet, see This article .) mplleaflet cannot save images by itself. It is necessary to save the image using a screenshot or the like.
#Data reading
origin = pd.read_csv('data/origins.csv') #Point of departure
dest = pd.read_csv('data/destinations.csv') #Arrival place
#Pointing
make_point = lambda row:Point(row['x'], row['y'])
origin['geometry'] = origin.apply(make_point, axis=1)
dest['geometry'] = dest.apply(make_point, axis=1)
origin_geo = gpd.GeoDataFrame(origin, geometry='geometry')
dest_geo = gpd.GeoDataFrame(dest, geometry='geometry')
#Coordinate system definition and transformation
rigin_geo.crs = CRS.from_epsg(3857)
dest_geo.crs = CRS.from_epsg(3857)
origin_geo = origin_geo.to_crs(CRS.from_epsg(3857))
dest_geo = dest_geo.to_crs(CRS.from_epsg(3857))
#plot
fig, ax = plt.subplots(figsize=(12,8))
origin_geo.plot(ax=ax)
dest_geo.plot(ax=ax)
mplleaflet.show() #Combine with map
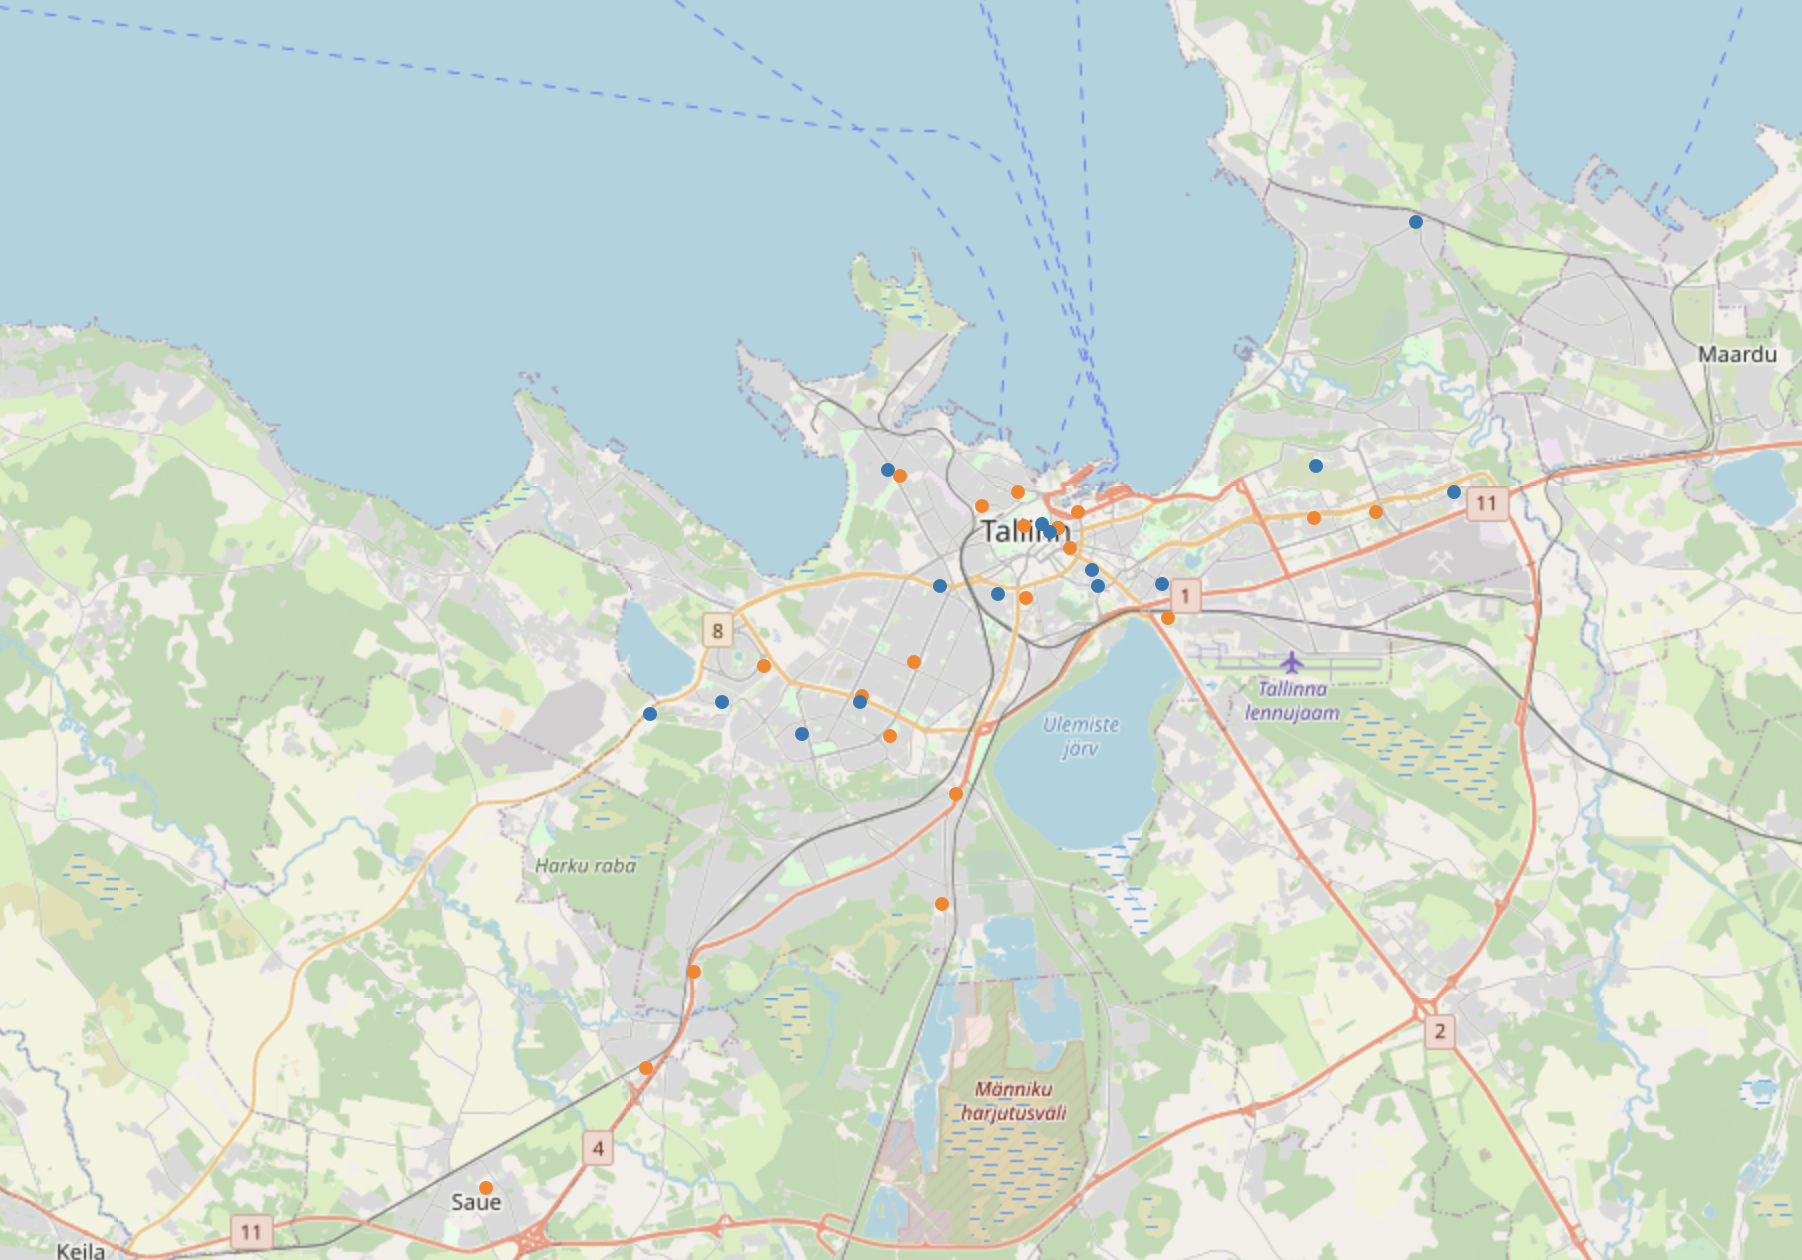 You can see that points are gathered near Tallinn, the capital of Estonia. Let's check by geocoding.
6-2 Tallinn network analysis
The goal is to find the route / distance between the starting point and the arrival point obtained in 6-1.
(1) Convert to a graph using the ʻosmxlibrary based on OSM road data ② Approximate the starting point / arrival store to the nearest node in the graph ③ Create the shortest route between nodes withnetworkx` and find its length
Work in this order.
#Creating a convex hull that includes all points
merged = pd.concat([origin, dest])
make_p = lambda row: (row['geometry'].x, row['geometry'].y)
merged['p'] = merged.apply(make_p, axis=1)
list_point = merged['p'].values.tolist()
multi = MultiPoint(list_point)
extent = multi.convex_hull
#Graph extraction
import osmnx as ox
graph = ox.graph_from_polygon(extent, network_type='drive')
#Create nodes and links from graphs
nodes_proj, edges_proj = ox.graph_to_gdfs(graph_proj, nodes=True, edges=True)
#Approximation of points to nodes
graph_proj = ox.project_graph(graph)
orig_nodes = []
for orig in origin_geo['geometry']:
    orig_xy = (orig.y, orig.x)
    orig_node = ox.get_nearest_node(graph, orig_xy)
    orig_nodes.append(orig_node)
dest_nodes = []
for des in dest_geo['geometry']:
    dest_xy = (des.y, des.x)
    dest_node = ox.get_nearest_node(graph, dest_xy)
    dest_nodes.append(dest_node)
#Create minimum path
route_lines = []
route_lengths=[]
for i in orig_nodes:
    for j in dest_nodes:
        if i==j: #Excludes if the starting and arriving points are close to the same point
            continue
        route = nx.shortest_path(G=graph, source=i, target=j, weight='length')
        route_nodes = nodes_proj.loc[route]
        route_line = LineString(list(route_nodes.geometry.values))
        route_lines.append(route_line)
        route_lengths.append(route_line.length)
route_geom = pd.DataFrame([route_lines, route_lengths]).T
route_geom.columns = ['geometry', 'route_dist']
route_geom = gpd.GeoDataFrame(route_geom,geometry='geometry', crs=edges_proj.crs)
#Shortest and longest distance
mini = route_geom['route_dist'].min()
maxx = route_geom['route_dist'].max()
#Visualization
fig, ax = plt.subplots(figsize=(12,8))
route_geom.plot(ax=ax, color='red')
edges_proj.plot(ax=ax, color='gray', alpha=0.5, linewidth=0.7)
fig.savefig('network.png')
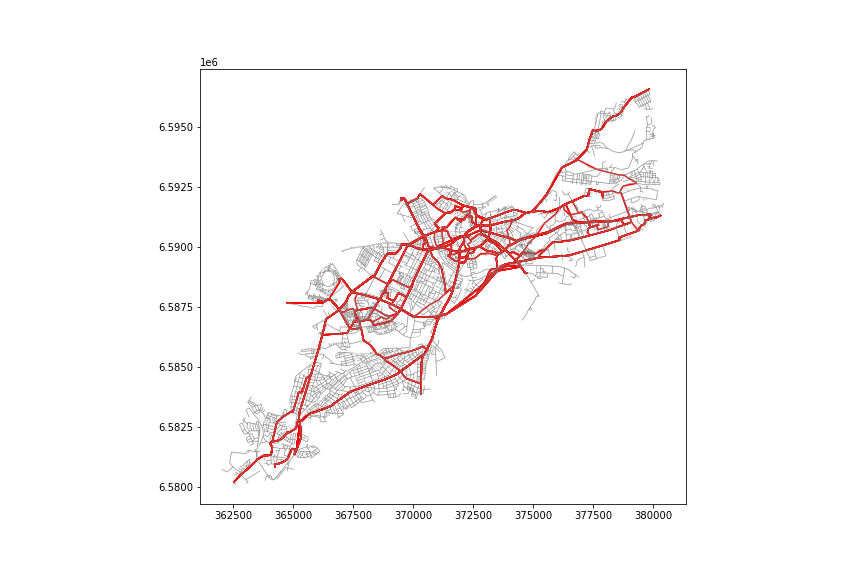 If you paint all the routes, it will look like the figure above. For network analysis, it seems that you can try various things using Python rather than using GIS.
Recommended Posts