[PYTHON] One-dimensional and two-dimensional vertex detection processing
One-dimensional vertex detection
When the convolution process is performed with [-1, 1], the rising part becomes a value exceeding 0 and the falling part becomes less than 0. Using this, an ascending flag and a descending flag are created. The point where the flags overlap is the apex.
import math
import matplotlib
import matplotlib.pyplot as plt
import numpy as np
import PIL.Image
import random
import scipy.ndimage

#One-dimensional vertex detection
x = np.array([0, 0, 1, 0, 0])
print("x", x, "Target array")
conv1 = np.convolve(x, [1, -1], mode="full")
print("conv1", conv1, "[-1, 1]Make marks for rising and falling points with the filter of")
flag1 = (conv1 > 0).astype(int)
print("flag1", flag1, "Flag of rising point")
flag2 = (conv1 <= 0).astype(int)
print("flag2", flag2, "Flag of descent point")
flag1 = flag1[:-1]
print("flag1", flag1, "Cut one end of the rising flag to match the length")
flag2 = flag2[1:]
print("flag2", flag2, "Remove one head of the descending flag to match the apex and align the length.")
flag3 = flag1 & flag2
print("flag3", flag3, "The result of ANDing the ascending flag and descending flag is the apex.")
Execution result
x [0 0 1 0 0]Target array
conv1 [ 0  0  1 -1  0  0] [-1, 1]Make marks for rising and falling points with the filter of
flag1 [0 0 1 0 0 0]Flag of rising point
flag2 [1 1 0 1 1 1]Flag of descent point
flag1 [0 0 1 0 0]Cut one end of the rising flag to match the length
flag2 [1 0 1 1 1]Remove one head of the descending flag to match the apex and align the length.
flag3 [0 0 1 0 0]The result of ANDing the ascending flag and descending flag is the apex.
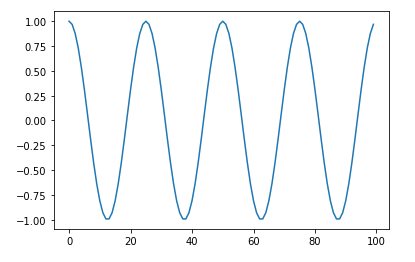
Creating a sample
cycle = 4
data = np.zeros(100)
cycleWidth = len(data) / cycle
unit = math.pi / cycleWidth * 2
for i in range(cycle):
    for j in range(int(cycleWidth)):
        data[i * int(cycleWidth) + j] = math.cos(unit * float(j))

plt.plot(data)
plt.show()
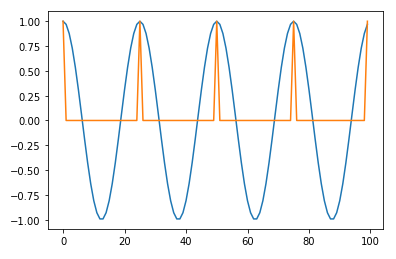
Perform vertex detection on the sample
#Functionize one-dimensional vertex detection
def detectPeak1D(x):
    conv1 = np.convolve(x, [1, -1], mode="full")
    flag1 = (conv1 > 0).astype(int)
    flag2 = (conv1 <= 0).astype(int)
    flag1 = flag1[:-1]
    flag2 = flag2[1:]
    flag3 = flag1 & flag2
    return flag3

peaks = detectPeak1D(data)
plt.plot(data)
plt.plot(peaks)
plt.show()
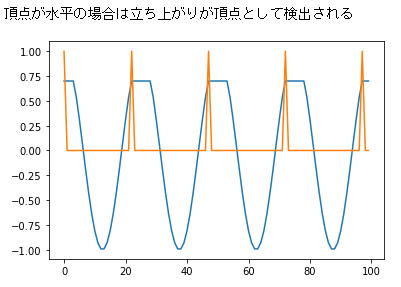
Rise is detected as a vertex for horizontal points
data[data > 0.7] = 0.7
peaks = detectPeak1D(data)
print("If the vertices are horizontal, the rise is detected as a vertex")
plt.plot(data)
plt.plot(peaks)
plt.show()
Two-dimensional vertex detection
Two-dimensional data is the result of ANDing the two "flags performed for all rows (two-dimensional array)" and "flags performed for all columns (two-dimensional array)" for one-dimensional vertex detection. To be the apex of
#Two-dimensional vertex detection
x = np.array([
    [0, 0, 1, 0, 0],
    [0, 2, 3, 2, 0],
    [1, 3, 5, 3, 1],
    [0, 2, 3, 2, 0],
    [0, 0, 1, 0, 0],
])
print(x, "Target data")
#Perform vertex detection on every row
peaks1 = []
for ix in x:
    peak = detectPeak1D(ix)
    peaks1.append(peak)
peaks1 = np.array(peaks1)
print(peaks1, "Horizontal vertex detection flag")
#Perform vertex detection on all columns
peaks2 = []
for ix in x.transpose():
    peak = detectPeak1D(ix)
    peaks2.append(peak)
peaks2 = np.array(peaks2).transpose() #Execute detection by transpose and return to the original
print(peaks2, "Vertical vertex detection flag")
peaks3 = (peaks1 & peaks2).astype(int)
print(peaks3, "The remaining flag after ANDing the row and column detection flags becomes the two-dimensional vertex flag.")
Execution result
[[0 0 1 0 0]
 [0 2 3 2 0]
 [1 3 5 3 1]
 [0 2 3 2 0]
 [0 0 1 0 0]]Target data
[[0 0 1 0 0]
 [0 0 1 0 0]
 [0 0 1 0 0]
 [0 0 1 0 0]
 [0 0 1 0 0]]Horizontal vertex detection flag
[[0 0 0 0 0]
 [0 0 0 0 0]
 [1 1 1 1 1]
 [0 0 0 0 0]
 [0 0 0 0 0]]Vertical vertex detection flag
[[0 0 0 0 0]
 [0 0 0 0 0]
 [0 0 1 0 0]
 [0 0 0 0 0]
 [0 0 0 0 0]]The remaining flag after ANDing the row and column detection flags becomes the two-dimensional vertex flag.
#Functionize two-dimensional vertex detection
def detectPeak2D(x):
    peaks1 = []
    for ix in x:
        peak = detectPeak1D(ix)
        peaks1.append(peak)
    peaks1 = np.array(peaks1)
    peaks2 = []
    for ix in x.transpose():
        peak = detectPeak1D(ix)
        peaks2.append(peak)
    peaks2 = np.array(peaks2).transpose()
    flag = (peaks1 & peaks2).astype(int)
    return flag
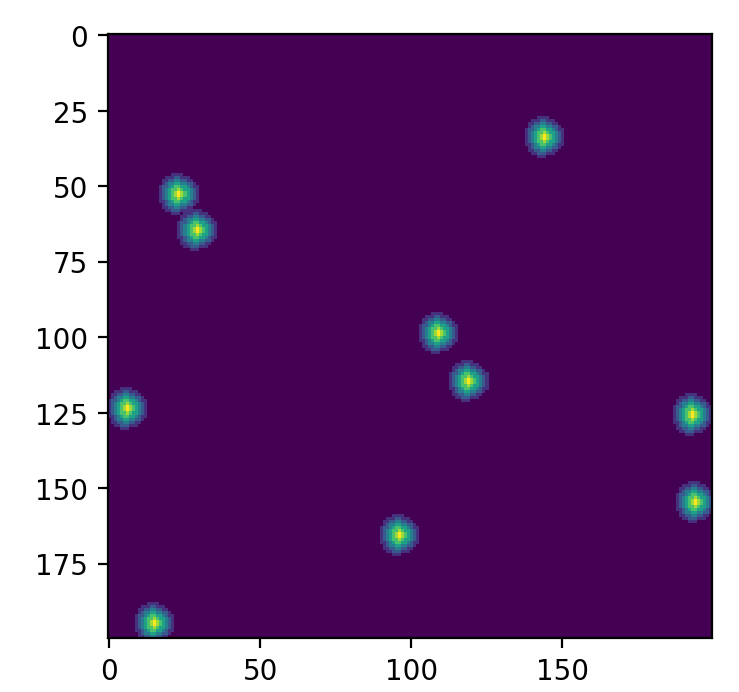
Creating a 2D data sample
#Create test data for 2D vertex detection, rotate data with 1D vertices
random.seed(1)
data2d = np.zeros((200, 200))
pattern = np.array([1, 2, 3, 4, 5, 6, 7, 6, 5, 4, 3, 2, 1])
for i in range(10):
    ox, oy = random.randrange(200), random.randrange(200)
    for j in range(50):
        rad = (math.pi / 50) * j
        for ix, v in enumerate(pattern):
            pos = ix - len(pattern) / 2
            x = ox + math.cos(rad) * pos
            y = oy + math.sin(rad) * pos
            if x < 0: continue
            if x >= 200: continue
            if y < 0: continue
            if y >= 200: continue
            data2d[int(x)][int(y)] = v

plt.figure(figsize=(10,4),dpi=200)
plt.imshow(data2d)
plt.show()
Two-dimensional sample image
Performing 2D vertex detection
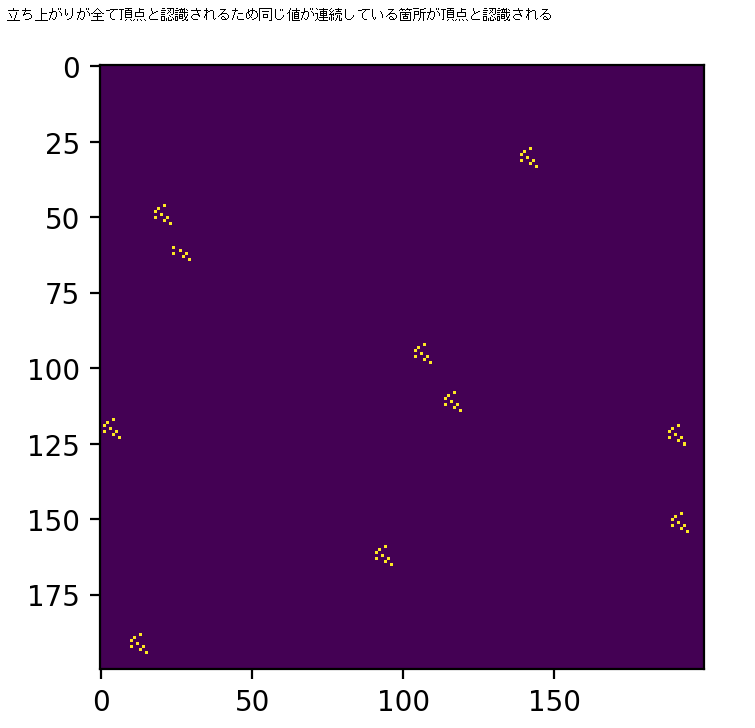
peaks = detectPeak2D(data2d)
print("Since all rising edges are recognized as vertices, points where the same value is continuous are recognized as vertices.")
plt.figure(figsize=(10,4),dpi=200)
plt.imshow(peaks)
plt.show()
Execution of 2D vertex detection after smoothing
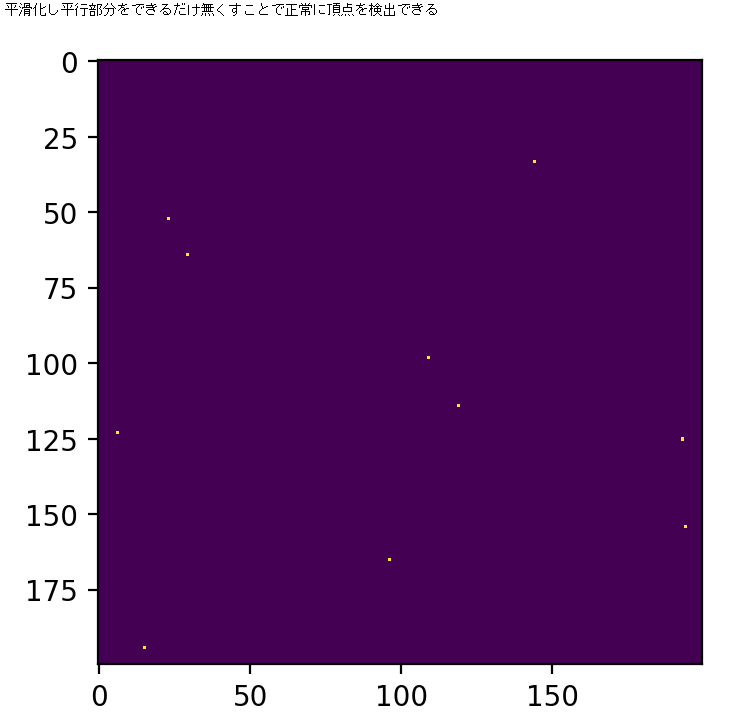
data2dGaussian = scipy.ndimage.gaussian_filter(data2d, sigma=1)
peaks = detectPeak2D(data2dGaussian)
print("Vertices can be detected normally by smoothing and eliminating parallel parts as much as possible.")
plt.figure(figsize=(10,4),dpi=200)
plt.imshow(peaks)
plt.show()
Attention etc.
There is no pre-processing or processing, and it is a process that assumes data that has a beautiful mountain shape. Basically, I think that it often does not work as expected unless it is smoothed, so use it as it is It doesn't matter if it is a moving average or a Gaussian filter, so use it after smoothing.
that's all.