[PYTHON] Watershed method in 3D images using ImageJ
background
In recent years, it has become easier to acquire 3D images, but the image processing libraries used for 3D images are not substantial. This time, I wanted to use a watershed method for 3D images, so I searched for it, and found that a plug-in for image processing software Fiji (Fiji is just imageJ) had a function for performing 3D morphology operations. So I tried it. From the following, we have summarized the introduction method and how to use the function.
environment
- Mac OS X 10.10.5 (Yosemite)
- ImageJ version : 2.0.0-rc-14/1.49g (http://imagej.net/Contributors)
Plug-in introduction
Download MorphoLibJ 1.3.1.jar from https://github.com/ijpb/MorphoLibJ/releases. To install with GUI, open Fiji and drag and drop the downloaded file. If you install from the terminal, you can put MorphoLibJ_-1.3.1.jar under /Applications/Fiji.app/plugins/. See below for the documentation for this plugin. http://imagej.net/MorphoLibJ#Watershed_segmentation
function
First, I created the following image on python, which is used as an example of using the function.
import numpy as np
import skimage.io as skimage
img = np.zeros((100, 100, 100))
for i in range(100):
    for j in range(100):
       for k in range(100):
          if (i - 40)**2 + (j - 40)**2 + (k - 40)**2 < 400:
             img[i][j][k] = 255
          if (i - 60)**2 + (j - 60)**2 + (k - 60)**2 < 900:
             img[i][j][k] = 255
skimage.imsave('example.tif', img.astype(uint8))
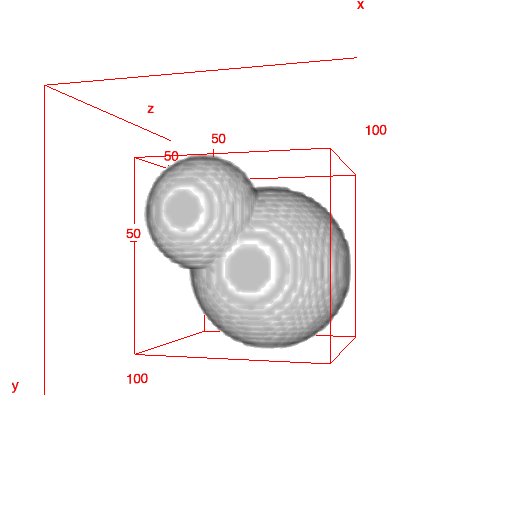
From here, we will summarize examples of function usage using this image. Visualize also uses the Plugin's 3D Viewer.
Distance Tranceform Watershed 3D
Plugin > MorphoLibJ > Binary Images > Distance Transform Watershed 3D

- Options
- Distance : Specifies the weight for calculating the Euclidean distance transformation. Parameters that affect the boundary surface of the output result.
- Output Type : Option to decide whether to use 16bit (short) or 32bit (float) when calculating the distance.
- Normalize weights : flag whether to normalize the distance map.
- Dynamic : A parameter that merges more objects with higher values and splits into more objects with lower values.
- Connecivity : Option to decide whether the calculation area in the attention voxel is near 6 or 26.
This time, the result of executing with the option specified in the above figure is shown below.

Image values are labeled for each object. However, in this state, it is difficult to see the difference even if visualized, so the function that performs color labeling will be described next.
Labels to RGB
Plugin > MorphoLibJ > Label images > Labels to RGB

- Options
- Colormap Selection of color map to label.
- background Color selection other than objects.
- Shuffle Flag of whether to make the color selection of the color map random.
Personally, it is good that the golden angle is prepared in the color map. The result of executing with the option specified in the above figure is shown below.

It can be seen that when two objects are originally merged, the area is divided by watershed.
Consideration
I tried to quantitatively verify how appropriate the divided objects are.
| object | volume[voxel] | 元のvolume[voxel] | Percentage[%] |
|---|---|---|---|
| Green | 31922 | 33493 | 95.31 |
| Blue | 104973 | 113040 | 92.86 |
At this time, the original volume represents a value obtained by calculating the volume from the radius determined when the image was created. The ratio was calculated from $ \ frac {volume} {original volume} \ times 100 $.
From this result, it can be seen that the objects are not divided into either object. Distance Transform Watershed In 3D, Distance is the parameter that most affects the division accuracy, but it may be better to use the ratio obtained here as one of the indexes when optimizing this parameter.
Recommended Posts