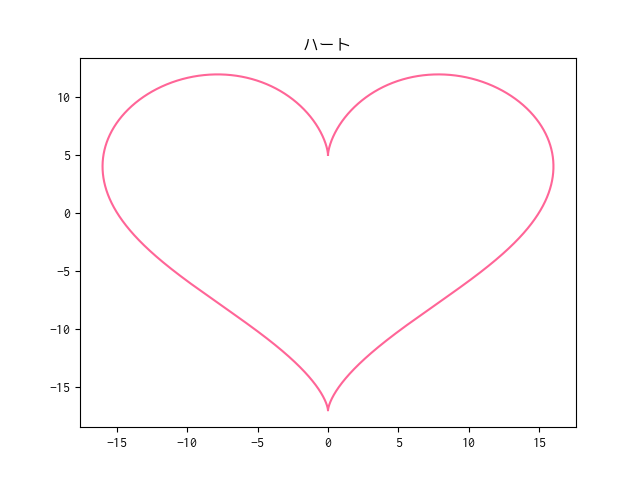
Zeichne ein Herz in Python
Überblick
[Einführung in die Mathematik ab Python](https://www.amazon.co.jp/Python%E3%81%8B%E3%82%89%E3%81%AF%E3%81%98%E3%82% Ich habe das Buch gekauft 81% E3% 82% 8B% E6% 95% B0% E5% AD% A6% E5% 85% A5% E9% 96% 80-Amit-Saha / dp / 4873117682). Da es eine große Sache war, entschied ich mich, ein Diagramm zu zeichnen, während ich mich auf "Kapitel 2 Visualisieren von Daten mit einem Diagramm" bezog. Ich mochte die süße Figur, also entschied ich mich zu zeichnen: Herz :.
Erstellen Sie zunächst eine Konfigurationsdatei für matplotlib als vorläufige Vorbereitung. Es war notwendig, "Backend" anzugeben, um das Diagramm in der macOS-Umgebung anzuzeigen, und "font.family", um Japanisch für den Titel des Diagramms zu verwenden.
~/.matplotlib/matplotlibrc
backend : TkAgg
font.family : Ricty Diminished
Kommen wir nun zum Hauptthema Zeichnen: Herz :. Ich habe die Formel auf der Seite Herzkurve verwendet.
draw_heart.py
from matplotlib import pyplot as plt
from math import pi, sin, cos


def draw_graph(x, y, title, color):
  plt.title(title)
  plt.plot(x, y, color=color)
  plt.show()


# range()Gleitkomma-Version der Funktion
# (Referenz)Erste Schritte mit Mathematik Beginnen mit Python 2.4.2.1 Gleitkommazahlgenerierung mit gleichem Abstand
def frange(start, final, increment=0.01):
  numbers = []

  while start < final:
    numbers.append(start)
    start = start + increment

  return numbers


def draw_heart():
  intervals = frange(0, 2 * pi)
  x = []
  y = []

  for t in intervals:
    x.append(16 * sin(t) ** 3)
    y.append(13 * cos(t) - 5 * cos(2 * t) - 2 * cos(3 * t) - cos(4 * t))

  draw_graph(x, y, title='Herz', color='#FF6597')


if __name__ == '__main__':
  try:
    draw_heart()
  except KeyboardInterrupt:
    # control +Beenden Sie mit C.
    pass
Wenn Sie dieses Python-Skript ausführen, wird ein schönes: heart: -Diagramm gezeichnet. Süß: entspannt:

Bonus
Die im obigen Skript implementierte Frange-Funktion könnte durch die Funktion [arange] von NumPy (https://docs.scipy.org/doc/numpy/reference/generated/numpy.arange.html) ersetzt werden. NumPy hat auch Funktionen wie "pi", "sin" und "cos", so dass Sie das "math" -Modul nicht benötigen, wenn Sie dieses Modul verwenden.
draw_heart.py
from matplotlib import pyplot as plt
from numpy import arange, pi, sin, cos


def draw_graph(x, y, title, color):
  plt.title(title)
  plt.plot(x, y, color=color)
  plt.show()


def draw_heart():
  intervals = arange(0, 2 * pi, 0.01)
  x = []
  y = []

  for t in intervals:
    x.append(16 * sin(t) ** 3)
    y.append(13 * cos(t) - 5 * cos(2 * t) - 2 * cos(3 * t) - cos(4 * t))

  draw_graph(x, y, title='Herz', color='#FF6597')


if __name__ == '__main__':
  try:
    draw_heart()
  except KeyboardInterrupt:
    pass
Recommended Posts